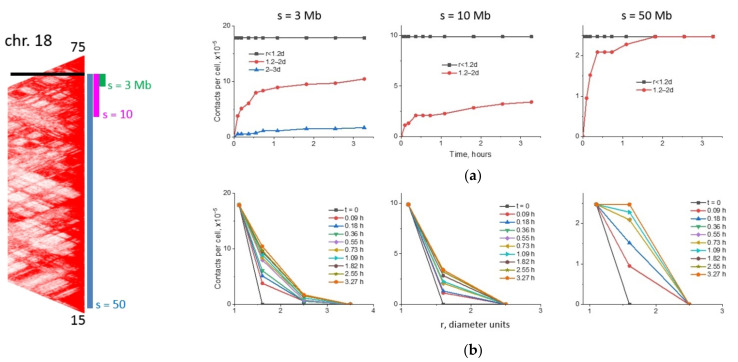
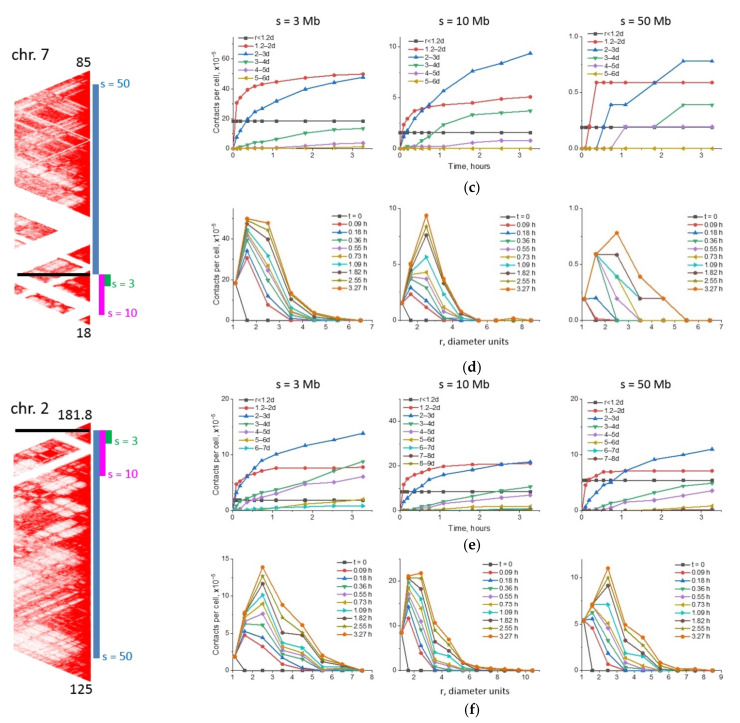
Figure 8.
The simulated dynamics of lesion contact formation. Left side: The segments of the calculated contact maps including the loci under consideration. The heteropolymer globule model of chromosomes. The numbers above and below are the genomic positions of the segments, Mb. The black lines indicate the positions of I-SceI site. The colored stripes to the right of the map show the genomic separations between the considered loci. Graphs: the examples of dynamics of locus pairs with genomic separations s = 3, 10 and 50 Mb from I-SceI site and at the spatial distance r, r + dr at the initial time. γ-radiation dose D = 5 Gy. (a,b) Chromosome 18; (c,d) chromosome 7; (e,f) chromosome 2. (a,c,e) The number of contacts formed during the time from 0 to t between the damaged loci located at different initial distances between them, in diameter units. (b,d,f) The number of contacts formed as a function of the initial distance between the damaged loci for different observation times t (observation interval from 0 to t).


