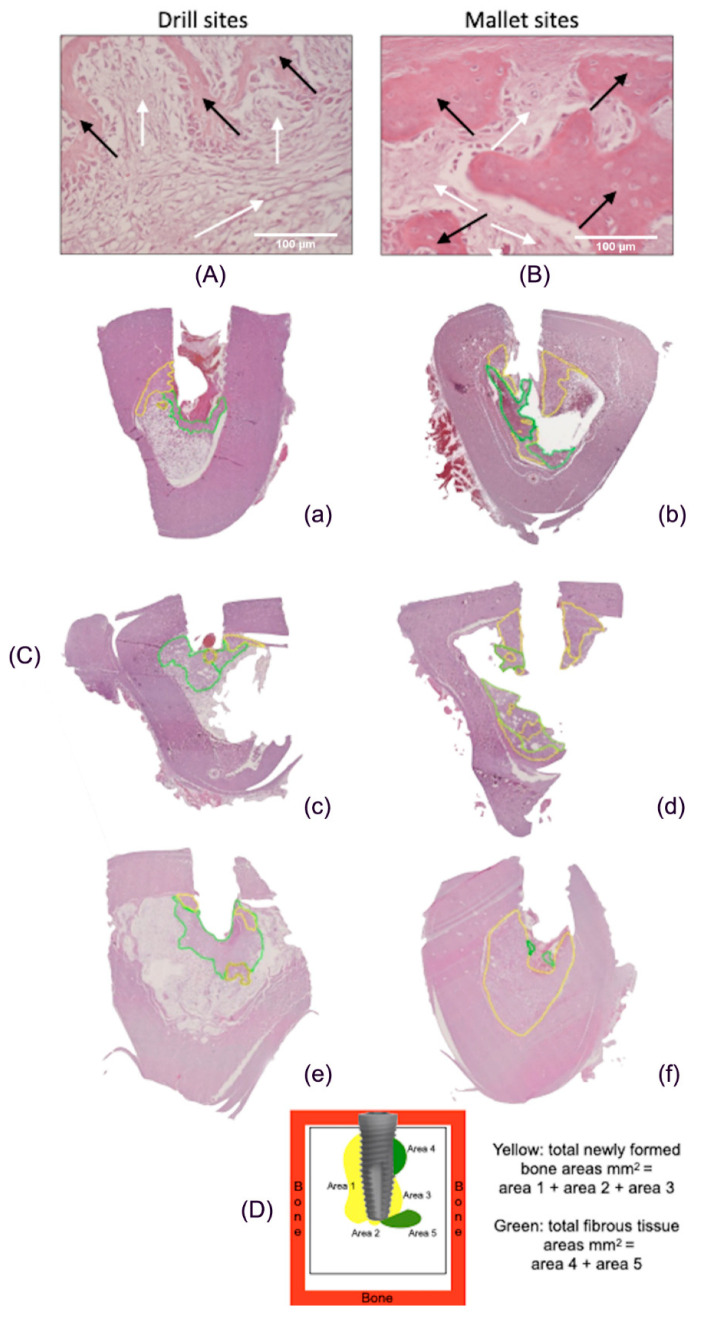
Figure 4.
Histological images of peri-implant tissues and scheme of area calculation. (A) The fibrous tissue (white arrows) was greater than newly formed bone tissue (black arrows) in drill-prepared sites (Hematoxylin and Eosin, 400×). (B) In the mallet site, the amount of newly formed bone tissue (black arrows) is greater than that of fibrous tissue (white arrows) (Hematoxylin and Eosin, 400×). (C) Areas of new bone and fibrous tissue deposition, expressed as total surface (mm2), using an imaging computer software, according to the Han, J.-M. et al. [19] protocol. In every picture, in yellow, areas of new bone deposition and in green, areas of fibrous tissue. (a,c,e): tissues from sites prepared with drill technique, in the three different animals; (b,d,f): tissues from sites prepared with mallet technique in the three different animals. The bone samples obtained from mallet sites show a greater area of newly formed bone and a lower area of fibrous tissue compared to drill ones. (D) Example of scheme for calculating the newly formed bone and fibrous tissue around the implants.

