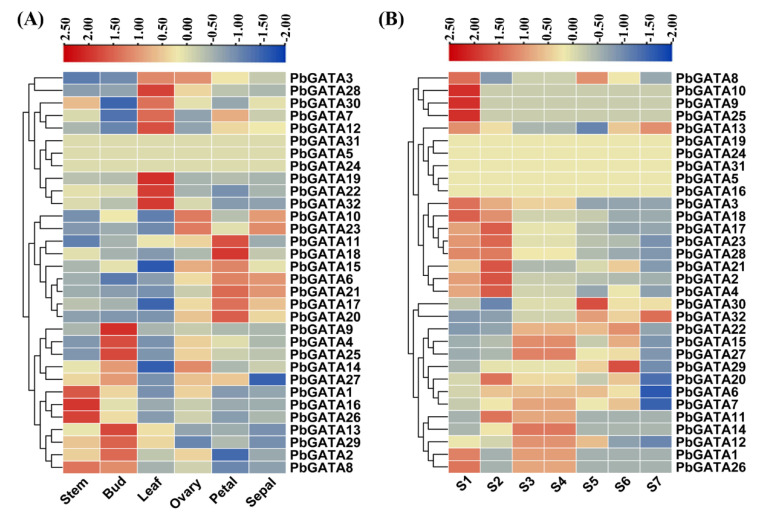
Figure 9.
A heat map is visualized to demonstrate the relative expression patterns of GATA genes. (A) The transcription patterns of the GATA gene family in organs (leaf, ovary, sepals, petals, bud, and stem). (B) The fruit of Chinese pear at different developmental stages (S1 to S7). Different colors correspond to log2 transformed values. Blue or violet color indicates no or lower relative transcripts abundance of each sample and red showed higher expression respectively.

