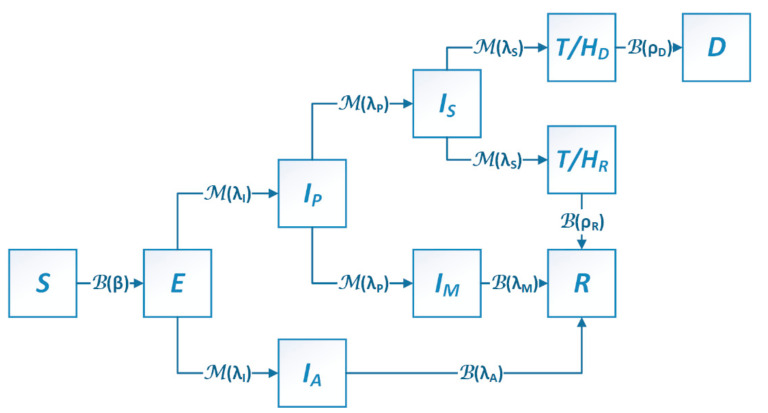
Figure 1.
Block diagram of the stochastic compartmental SEIR model. Population “movements” between compartments (blocks representing stochastic states) follow binomial (B) or multinomial (M) distributions that are controlled by biological/epidemic parameters as marked on the arrows. S = susceptible, E = exposed, Ip = presymptomatic, IA = asymptomatic, Is = severely symptomatic, IM = mildly symptomatic, T/HD = treated/hospitalized to death, T/HR = treated/hospitalized to recovery, R = recovered, D = dead. β = transmission rate. Definitions of other parameters are listed in Table S1.

