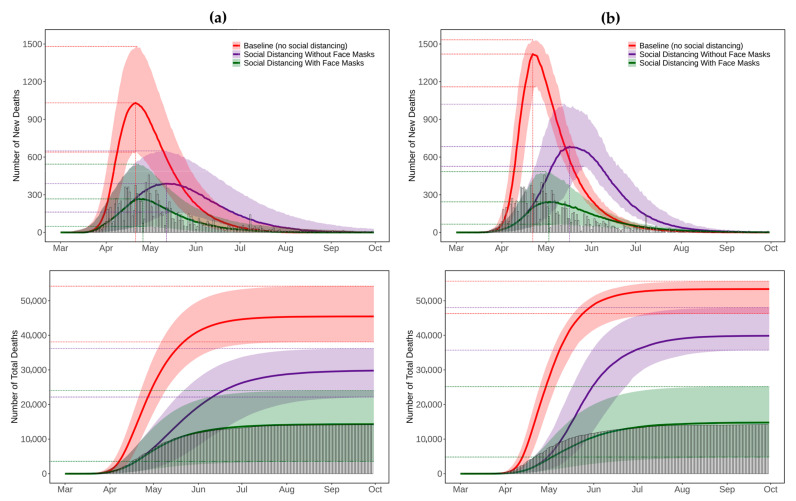
Figure 10.
Comparison of projected trajectories of new/total deaths from COVID-19 calculated for different exposure scenarios with reported death data (vertical bars) for New Jersey using (a) summation of predictions from 21 county-level SEIR models, and (b) predictions from the statewide SEIR model. The color-shaded areas depict the 95% Confidence Interval (CI) of the corresponding predictions.

