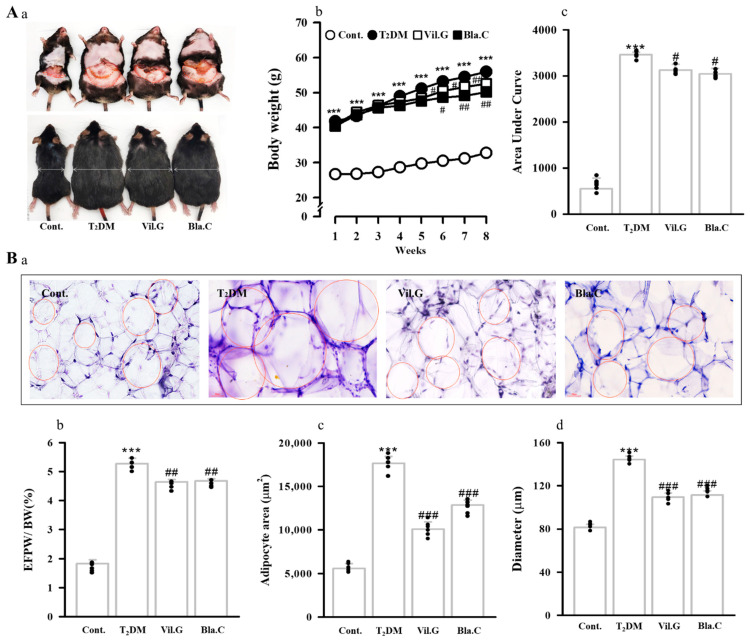
Figure 2.
Effect of blackcurrant treatment on the changes in body weight and epididymal fat pad in type 2 diabetes mellitus mice (T2DM mice). Representative image of visceral fat distribution for each mice group (Aa). Changes in body weight ((Ab), n = 8 per group). Integral area under the curve (AUC, (Ac)). Representative microscope images of Oil Red O staining of epididymal fat pad ((Ba), n = 3 per group). Bottom panel indicates the weight, area, and size (Bb–Bd) of adipose cells. BW, body weight; EFPW, epididymal fat pad weight; Cont, control (db/m mice); T2DM, type 2 diabetes mellitus mice (db/db mice); Vil.G, db/db + vildagliptin 50 mg/kg/day, positive control, dipeptidyl peptidase-4 (DPP-4) inhibitor; Bla.C, db/db + blackcurrant 200 mg/kg/day. Data are shown as mean ± S.E. *** p < 0.001 vs. Cont.; # p < 0.05, ## p < 0.01, ### p < 0.001 vs. T2DM.

