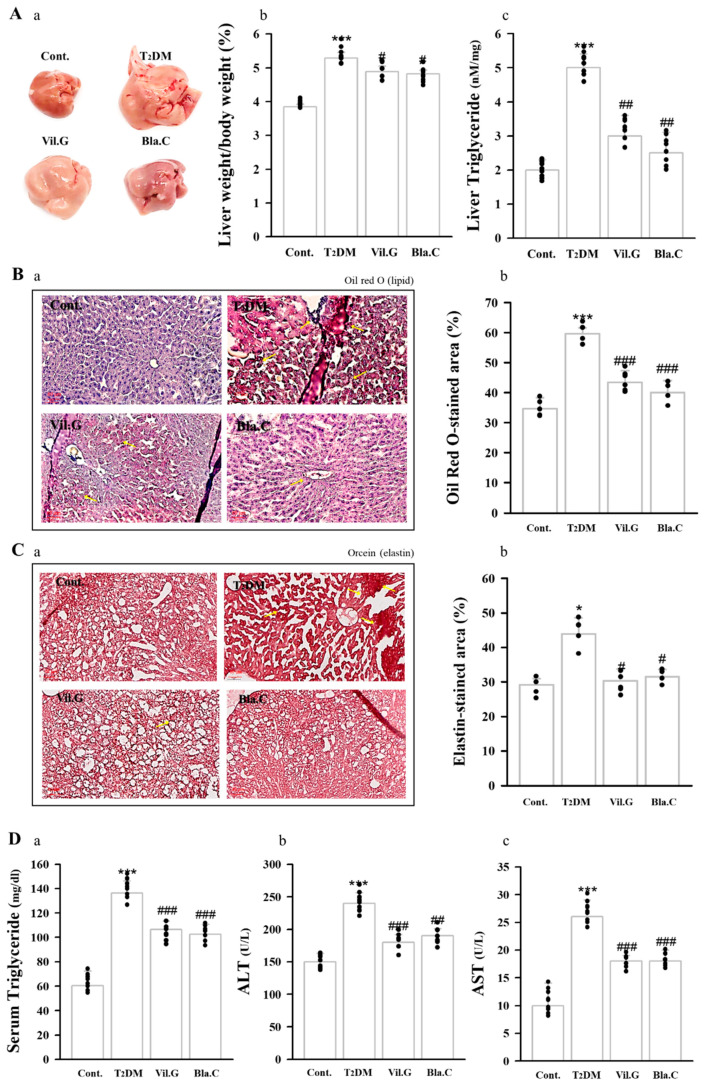
Figure 4.
Effects of blackcurrant on hepatic histopathology and function in type 2 diabetes mellitus mice (T2DM mice). A representative photograph of the liver observed with the naked eye (Aa). Liver weight/body weight ratio (Ab) and liver triglyceride levels (Ac) of type 2 diabetic mice. Representative images of liver tissue stained with Oil Red O (B) and Orcein stain (C) to confirm histopathological changes (n = 3 per group). Yellow arrows indicate the location of lipids (Ba) and elastic fibers (Ca). Graphs quantifying the lipid-stained area (Bb) and elastin-stained area (Cb). Graphic of serum triglyceride (Da), ALT (Db), and AST (Dc) plasma levels in db/db mice (n = 8 per group) Cont, control (db/m mice); T2DM, type 2 diabetes mellitus mice; Vil.G, T2DM + vildagliptin 50 mg/kg/day, positive control, dipeptidyl peptidase-4 (DPP-4) inhibitor; Bla.C, T2DM + blackcurrant 200 mg/kg/day; AST, aspartate aminotransferase; ALT, alanine aminotransferase. Data are shown as mean ± S.E. * p < 0.05, *** p < 0.001 vs. Cont.; # p < 0.05, ## p < 0.01, ### p < 0.001 vs. T2DM.

