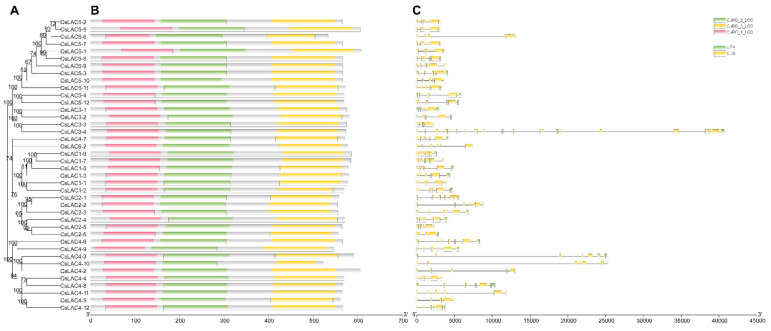
Figure 3.
Phylogenetic tree of CsLACs as well as protein conserved domain and gene structure of corresponding CsLACs. (A) Phylogenetic tree of CsLACs, as shown in Figure 1. (B) Conserved protein motifs and their distribution. The boxes with different colors represent the conserved motifs. (C) Exon-intron structure. The CDS, UTR (untranslated region) and introns are represented by yellow boxes, green boxes and gray lines, respectively.

