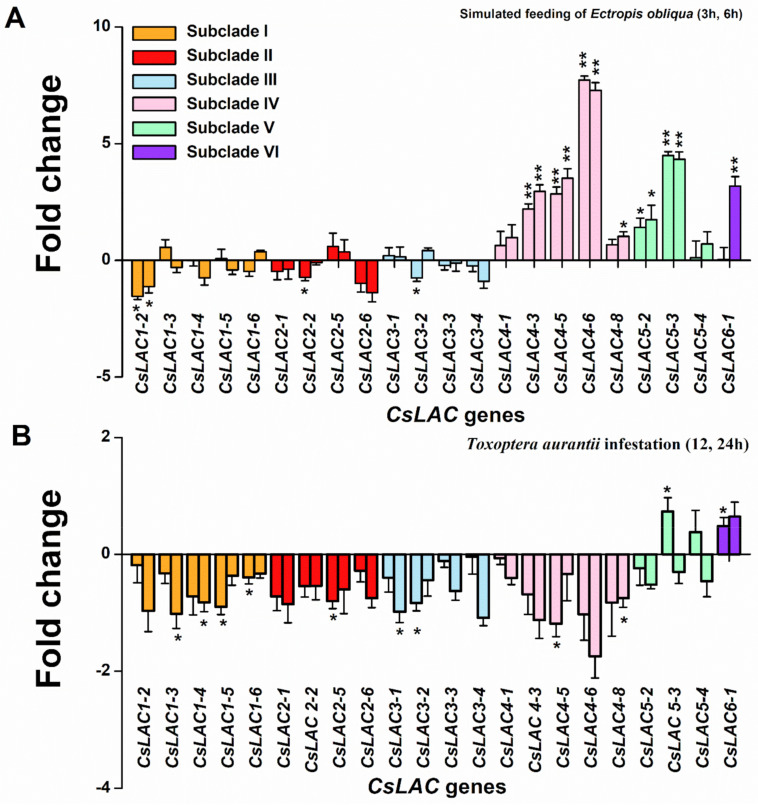
Figure 8.
Expression patterns of differentially expressed CsLACs from C. sinensis cv ‘Longjing43′ cultivars upon herbivory infestation. The fold change in expression levels (treated group vs. control group) is shown on a log2 scale. (A) The change in expression levels of CsLACs in response to simulated Ectropis obliqua feeding by RT-qPCR. The left and right bar graphs for each gene represent the fold change after treatment at 3h and 6h, respectively. (B) The change in expression levels of CsLACs in response to Toxoptera aurantii infestation by RT-qPCR. The left and right bar graphs for each gene represent the fold change after treatment at 12h and 24h, respectively. The asterisks above lines indicate significant differences between the herbivore treatment and the control (*, p < 0.05, **, p < 0.01, Student’s t-test).

