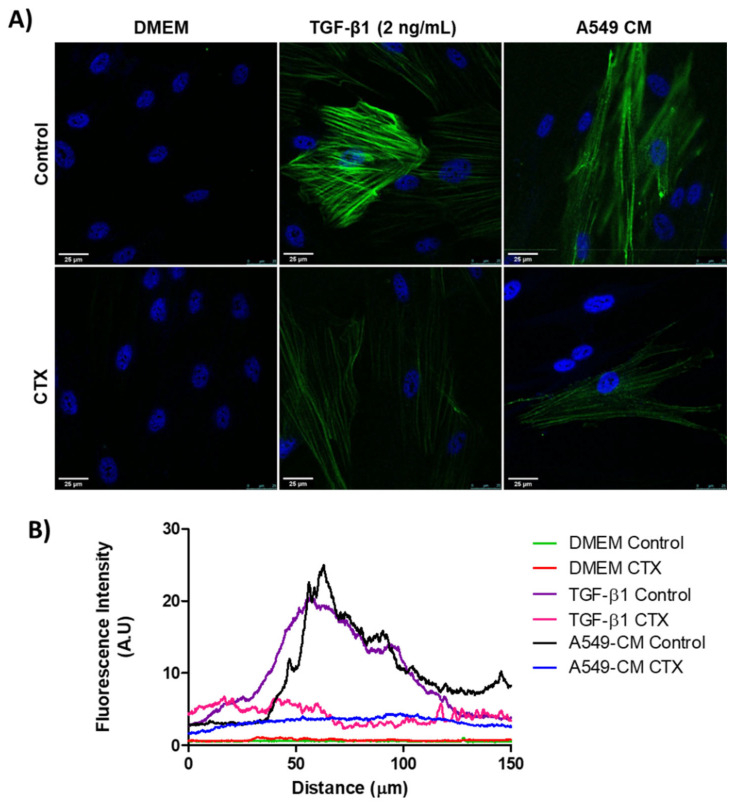
Figure 1.
Myofibroblast differentiation with various stimulatory factors. (A) Representative immunofluorescent images of MRC-5 cells pretreated with CTX (12.5 nM) for 2 h and then incubated in DMEM (with 10% FBS), TGF-β1 (2 ng/mL), or tumor-conditioned media from A549 cells for 3 days. The control group of cells were untreated and grown in DMEM with 10% FBS only. (B) Quantification of α-SMA fluorescence intensity. Green fluorescence indicates α-SMA-containing stress fibers and blue fluorescence indicates the nuclei. Scale bar = 25 µm. The data are presented from three independent experiments.

