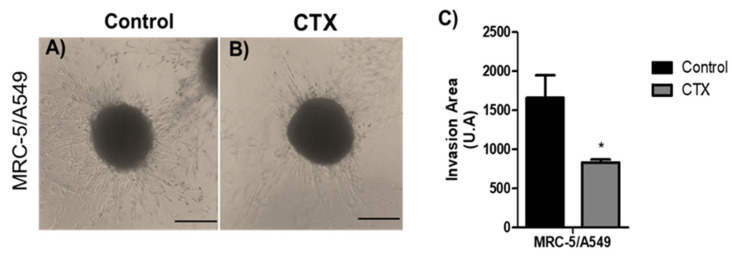
Figure 3.
Invasion area of spheroids in 3D collagen gels. Representative images are of invasion into type I collagen gel (1.2 mg/mL) (A) by cells of MRC-5/A549 spheroids or (B) MRC-5/A549 constituted with 12.5 nM of CTX. Cell invasion was photographed under phase-contrast microscopy at 48 h. (C) Cell invasion area was measured and analyzed on ImageJ software. * p < 0.05 compared to the control group. The data presented here are from three independent experiments (n = 5).

