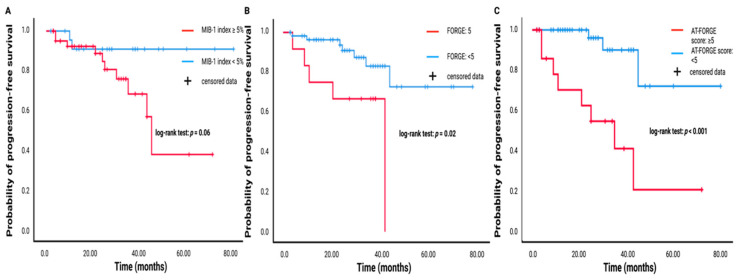
Figure 4.
Kaplan–Meier analysis of probability of progression-free survival stratified by MIB-1 index (A), FORGE score (B), and AT-FORGE score (C). Red lines display the arms with shorter time to meningioma progression, whereas the blue lines represent the superior groups regarding progression-free survival. Vertical dashes represent censored data (=progression-free at last clinical visit) within both progression-free survival curves. The time axis is right-censored at 80 months. p < 0.001 (log-rank test).

