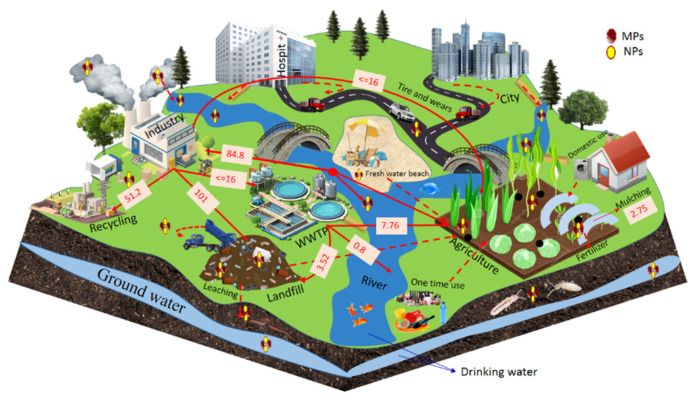
Figure 2.
Estimates of plastic sources and transport pathways in the environment as reported in scientific literature; the data is indicated in million tons as well as the average data of high and low transportation in the ecosystem, arrows represent the known transportation and dashes represent unknown transportation in the ecosystem.

