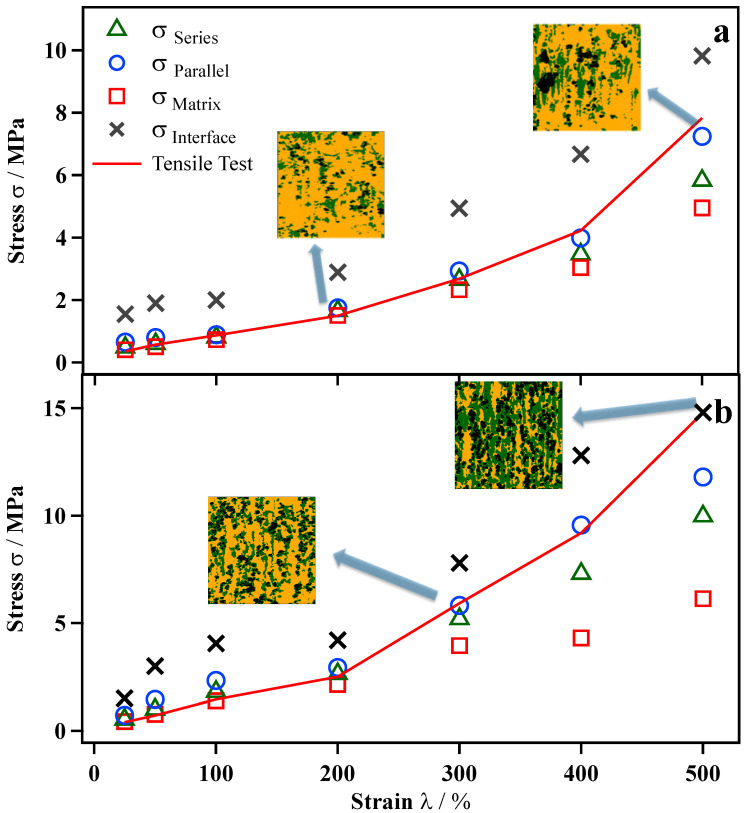
Figure 5.
Comparison of macroscopic tensile data (red line) and PeakForce QNM AFM results (point) based on series and parallel model discussed in the text for stress of CB (4.9%, 10 phr)/IR (a) and CB (13.2%, 30 phr)/IR (b) as a function of the elongation. Because the CB does not actually carry the stress, it is reduced to a two-phase model here. The black area is CB, the yellow area is IR rubber, and the green area is the interface.

