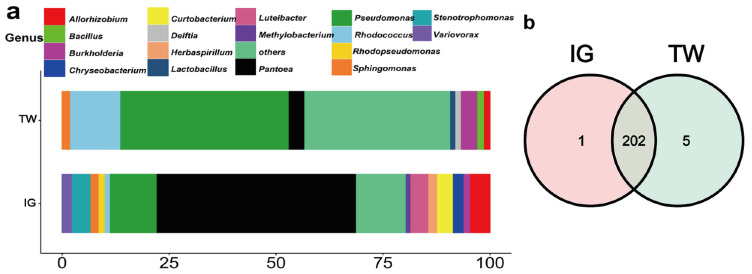
Figure 2.
The community composition of bacteria at the genus level in Lithosaphonecrus arcoverticus galls and the galled twigs of Lithocarpus glaber. IG and TW indicate L. arcoverticus galls and the galled twigs of L. glaber, respectively. (a) The relative abundance of high abundance genera. The horizontal coordinate indicates the relative abundance of the high abundance genera. The bacterial genera with a relative abundance above 1% are defined as high abundance genera. Bacterial genera with a relative abundance below 1% are grouped as “others”. (b) The Venn diagram of the community composition of bacteria in L. arcoverticus galls and galled twigs. The number shows the number of bacterial genera unique or common to L. arcoverticus galls and galled twigs.

