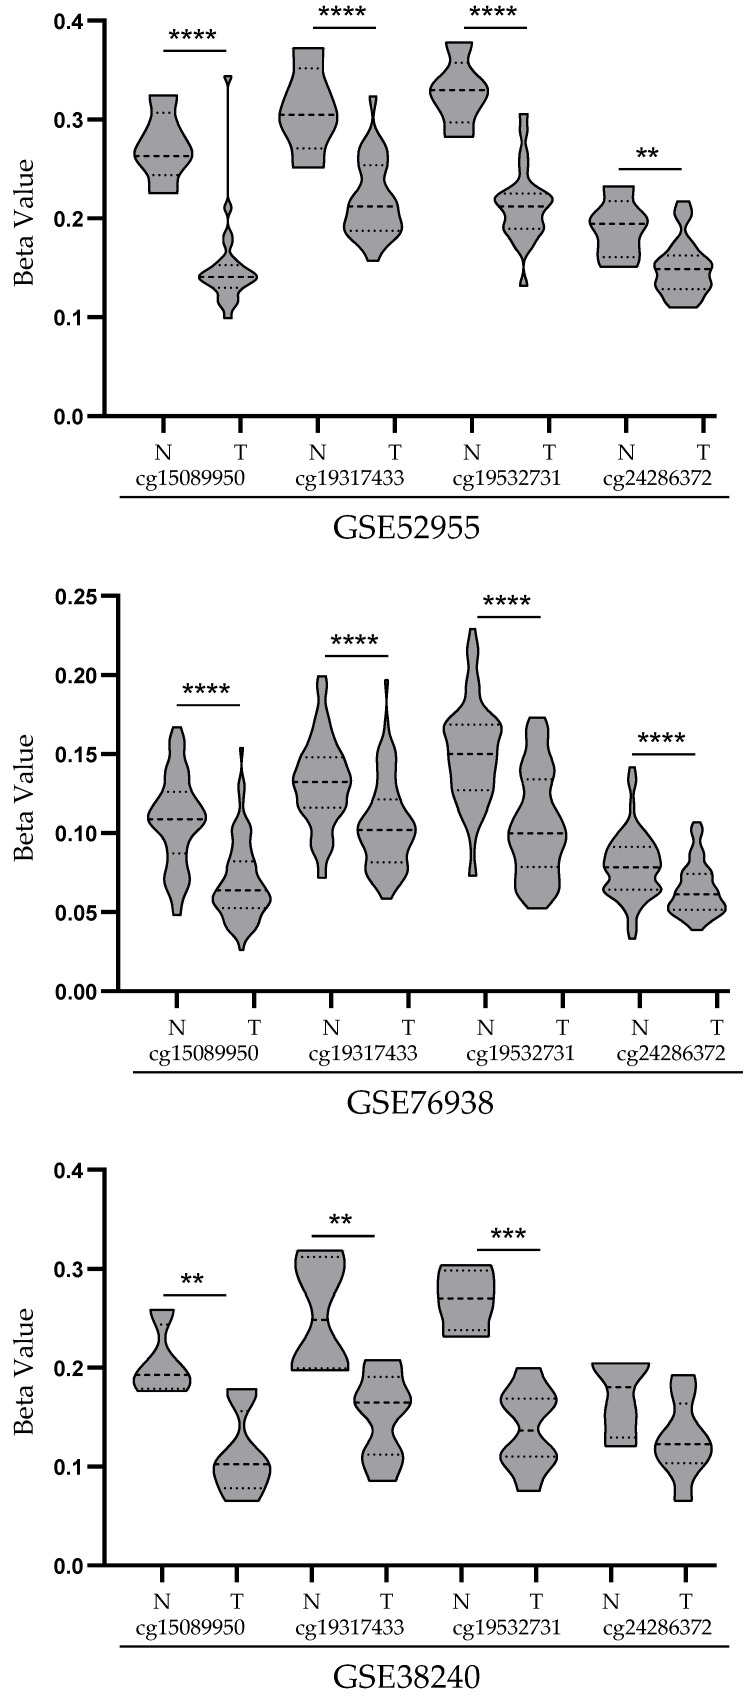
Figure 3.
STEAP1 promoter methylation levels (beta value) in GSE52955, GSE76938 and GSE38240 datasets. Each dataset represents methylation levels of STEAP1 in prostate tumor tissue (T) and normal prostate tissue (N) for the four probes (cg15089950, cg19317433, cg19532731 and cg24286372). Violin plots were obtained with GraphPad Prism 8.0.1, and mean methylation levels between normal and tumor were compared with a student’s t-test. ** p < 0.01, *** p < 0.001 and **** p < 0.0001.

