Figure 1.
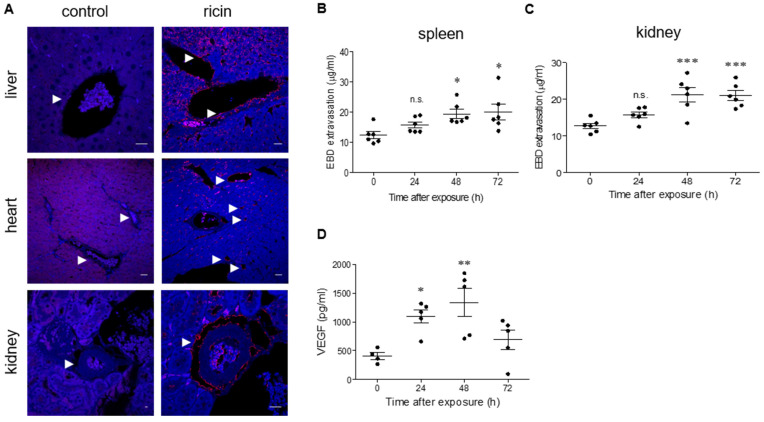
Ricin binding and organ hyperpermeability in ricin-intoxicated mice. (A) Immunofluorescence (red) of liver, heart and kidney sections before (control) or 30 min after incubation with ricin (5 µg/mL). The arrows indicate blood vessels and ricin binding. Nuclei stained by DAPI appear in blue. Scale bar: 20 µm (representative sections of n = 3 mice/group are shown). EBD in the spleen (B) and kidneys (C) following ricin intoxication. Control (0 h) or ricin-intoxicated mice (2LD50 i.m., 18 µg ricin/kg body weight) were intravenously injected with 50 mg/kg EBD at the indicated time points and tissues were harvested 1 h later and monitored for EBD content. Each dot represents an individual mouse. (D) Circulating VEGF levels were determined in the serum samples from non-intoxicated (0 h) and ricin-intoxicated mice at the indicated time points. Each dot represents an individual mouse. In (B–D), the results are depicted as means ± SEM. Statistical analyses were performed by one-way ANOVA followed by Dunnett’s post hoc test. * p < 0.05; ** p < 0.01; *** p < 0.001; n.s., not significant.

