Figure 5.
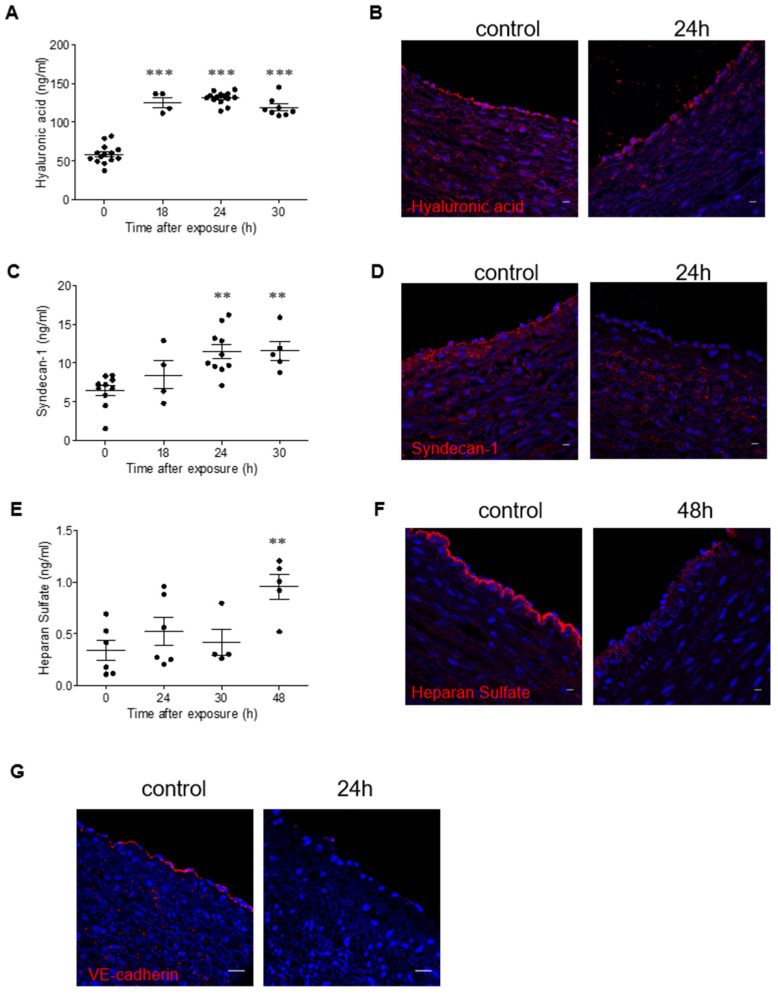
Shedding of the glycocalyx in ricin-intoxicated swine. (A,C,E) Circulating levels of HA (A), syndecan-1 (C) and HS (E) determined in control animals and in ricin-intoxicated animals at the indicated time points after intramuscular exposure (7.5 µg/kg). Each dot represents an individual pig. (B,D,F,G) Immunofluorescence (red) of HA (B), syndecan-1 (D), HS (F) and VE-cadherin (G) in the apical side of swine arteries of control animals and of ricin-intoxicated animals at the indicated time points after intramuscular exposure (7.5 µg/kg). The lumen of the vessel is always upwards. Nuclei stained by DAPI appear in blue. Scale bar: 20 µm (representative sections of n = 3 swine/group are shown). The results are depicted as means ± SEM. Statistical analyses were performed by one-way ANOVA followed by Dunnett’s post hoc test. ** p < 0.01; *** p < 0.001.

