Figure 6.
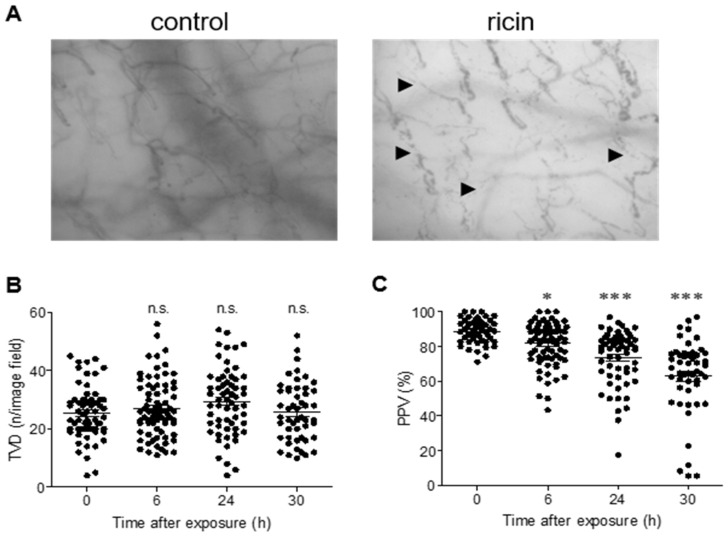
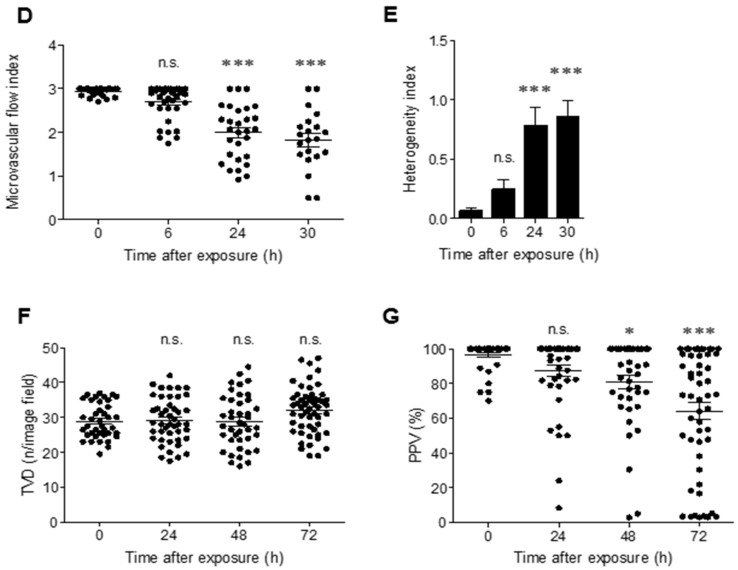
Measurement of microcirculation functionality in ricin-intoxicated swine and mice. (A) Representative SDF images of the sublingual microcirculation in swine before (control) or 30 h after ricin exposure (7.5 µg/kg). The arrows indicate areas with impaired microvascular flow. Microcirculatory parameters TVD (B), PPV (C), MFI (D) and HI (E) were determined in swine before (0 h) or at the indicated time points after ricin exposure. (n = 5 in each group; each dot represents data from an individual movie). TVD (F) and PPV (G) were determined in the cecum of mice before (0 h) or at the indicated time points after ricin exposure (18 µg/kg) (n = 5 in each group; each dot represents data from an individual movie). The results are depicted as means ± SEM. Statistical analyses were performed by one-way ANOVA followed by Dunnett’s post hoc test. * p < 0.05; *** p < 0.001; n.s., not significant.


