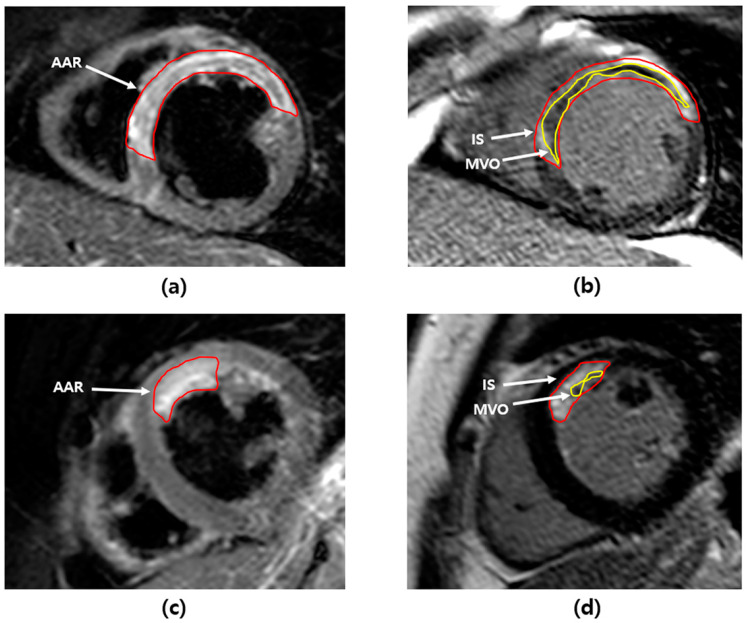
Figure 2.
Cardiac magnetic resonance images of acute myocardial infarction. (a) AAR (55.2%) in T2-weighted image and (b) IS (44.8%) and MVO (10.4%) in late gadolinium hyperenhancement image of a patient in the high serum lactate group. (c) AAR (12.3%) in T2-weighted image and (d) IS (8.8%) and MVO (4.3%) in late gadolinium hyperenhancement image of a patient in the low serum lactate group. AAR = area at risk, IS = infarct size, MVO = microvascular obstruction.

