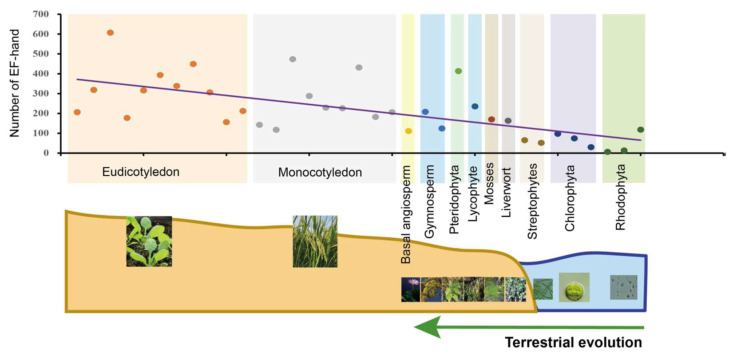
Figure 4.
Statistics and analysis of the quantity of EF-hand domains in 35 plants and algal species. These species were classified into 11 evolutionary clades indicated by different colors. Each point in the different colors, arranged by evolutionary process, represents one species each. The same-color points are located at the same evolutionary stage. Fitted trendlines indicate that the quantity of EF-hand domains is increasing. Relevant data was integrated with superfamily databases and local retrieval was performed with the Hidden Markov Model (HMM) using hmmsearch (http://www.hmmer.org/; accessed on 13 June 2021).

