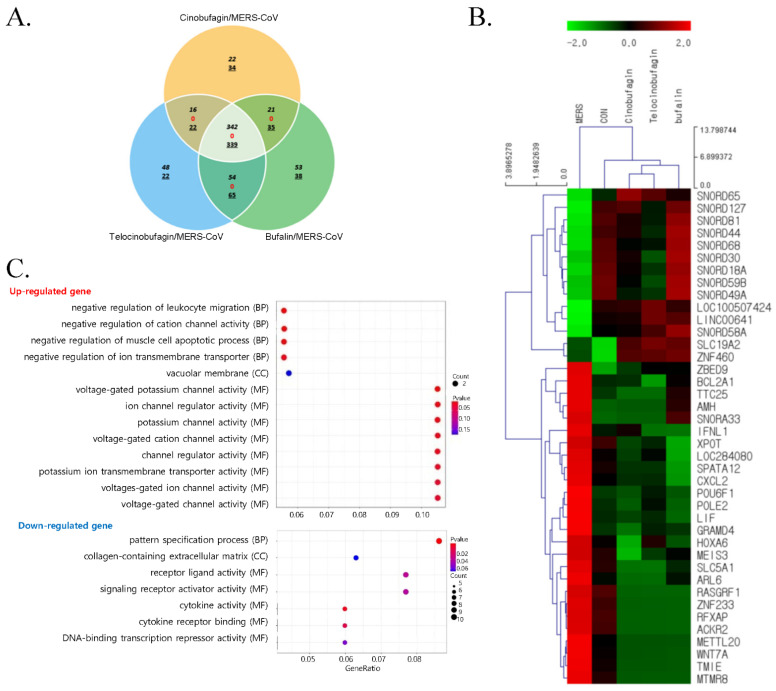
Figure 2.
Gene expression patterns following treatment with cinobufagin, telocinobufagin, or bufalin during MERS-CoV infection. (A) Venn diagram analysis of the number of overlapping upregulated (in italics), contraregulated (red), or downregulated (underlined) genes by 10 μM cinobufagin, telocinobufagin, or bufalin treatment in Calu-3 cells during 24 h of MERS-CoV infection versus MERS-CoV infection (fold change, 4; log2 normalized RC of ≥8). (B) Expression heatmap and clustering analysis of 40 significant differentially expressed genes (DEG) during 24 h of MERS-CoV-infected Calu-3 and control cells treated with cinobufagin, telocinobufagin, or bufalin (fold change, 4; log2 normalized read count [RC] of ≥4). (C) Gene Ontology biological processing (BP), cellular component (CC), molecular function (MF) terms of upregulated and downregulated genes in cinobufagin-, telocinobufagin-, or bufalin-treated Calu-3 cells during MERS-CoV infection. The related GO terms were ranked according to gene ratio (selection counts/selection size). The circle size and color indicate the selection counts and p-value, respectively (Fold change, 4; log2 normalized RC of ≥2).

