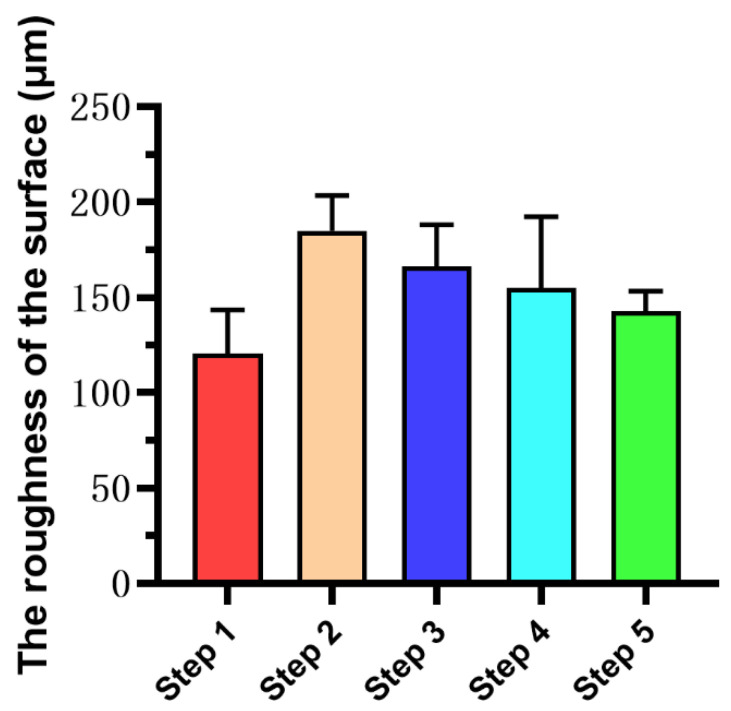
Figure 6.
The roughness of the surface of teeth in each step. There was no statistical difference between steps. The surface roughness of Step 5 was similar to that of Step 1. The surface roughness of the samples of Step 2 increased due to demineralization, and the surface roughness of the samples was decreased after treatment with Icon-Etch (Step 3) and Icon-Dry (Step 4).

