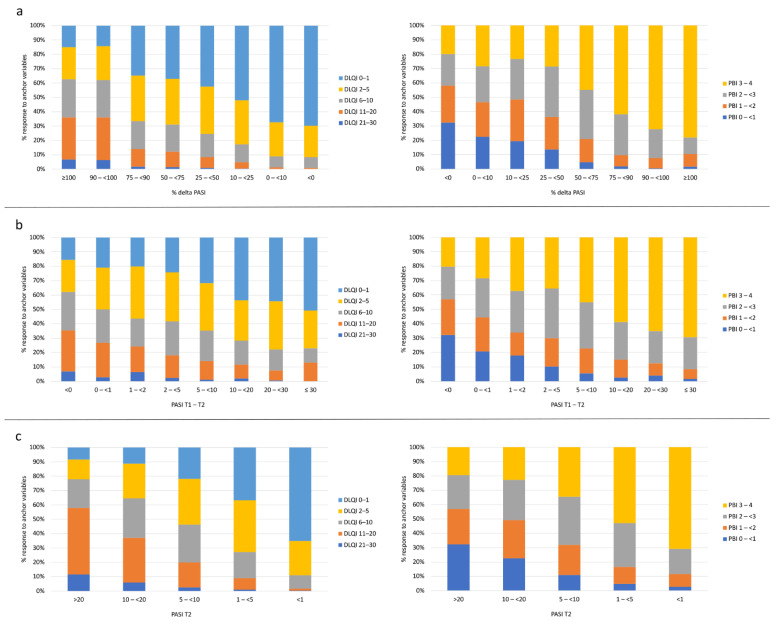
Figure 2.
Association of Psoriasis Area and Severity Index (PASI) outcomes % delta PASI (a), absolute PASI difference T1–T2 (b), and the resulting PASI at T2 (c) related to DLQI classes at T2 (left column) and to Patient Benefit Index (PBI) groups at T2 (right column). T1 refers to baseline and T2 to 3 months follow-up.

