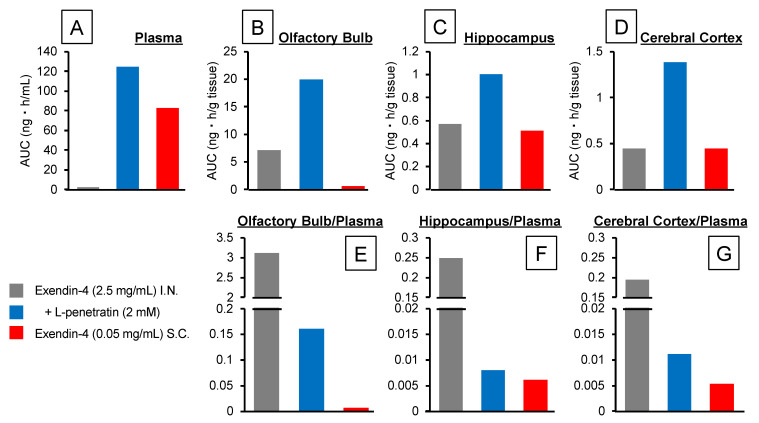
Figure 2.
Area under the concentration-time curve (AUC) calculated with the time-course profiles of Exendin-4 concentration after intranasal or subcutaneous administration to mice. Panels (A–D) show the AUCs in plasma, olfactory bulbs, hippocampus, and cerebral cortex, respectively. Panels (E–G) show the ratios of AUCs derived from the olfactory bulbs, hippocampus, and cerebral cortex per plasma, respectively.

