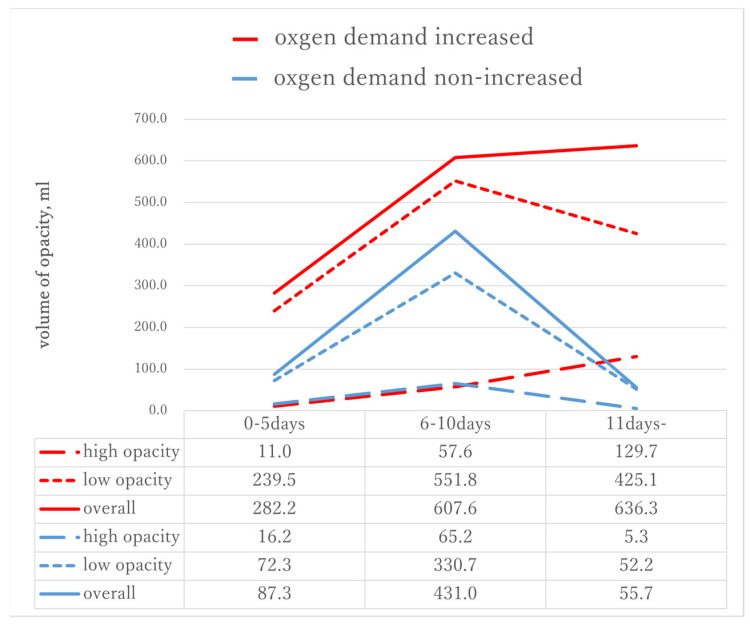
Figure 3.
Change in the volume of each type of opacity on the chest CT from the time of the initial onset of symptoms. The low opacity volume peaked during the middle period and decreased during the late period for both the increased oxygen demand and the nonincreasing oxygen demand groups. Conversely, the high opacity volume increased during the late period for the increased oxygen demand group but decreased for the nonincreased oxygen demand group.

