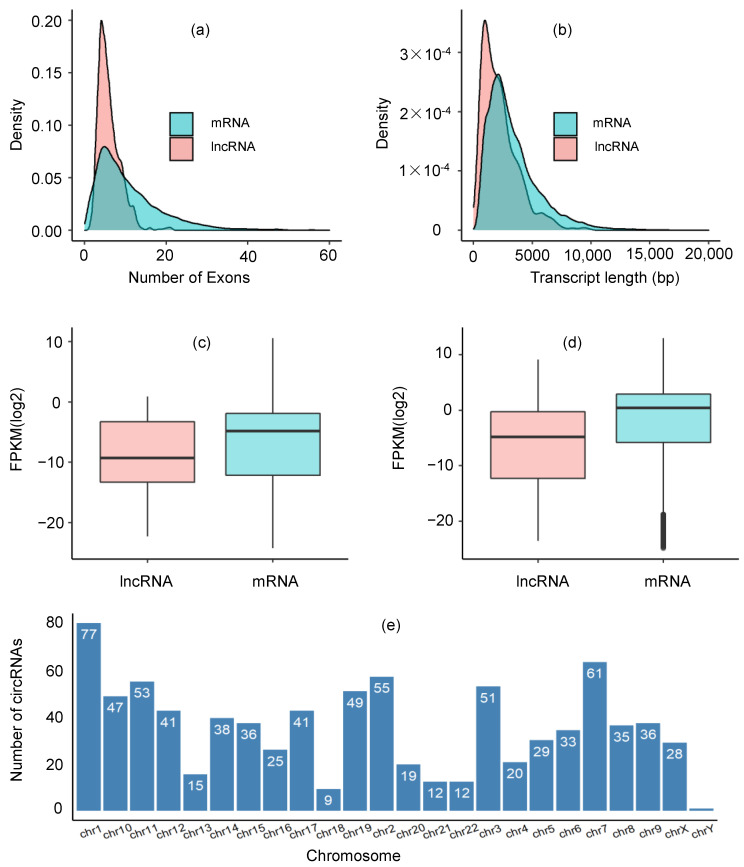
Figure 1.
Expression profile of candidate lncRNA transcripts. Density plot for the number of exons in mRNA and lncRNA transcripts (a), the length of mRNA and lncRNA transcripts (b), expression levels (FPKM) of mRNA and lncRNA transcripts in normal samples (c), expression levels (FPKM) of mRNA and lncRNA transcripts in TNBC patients (d) and chromosome distribution of the candidate lncRNAs (e).

