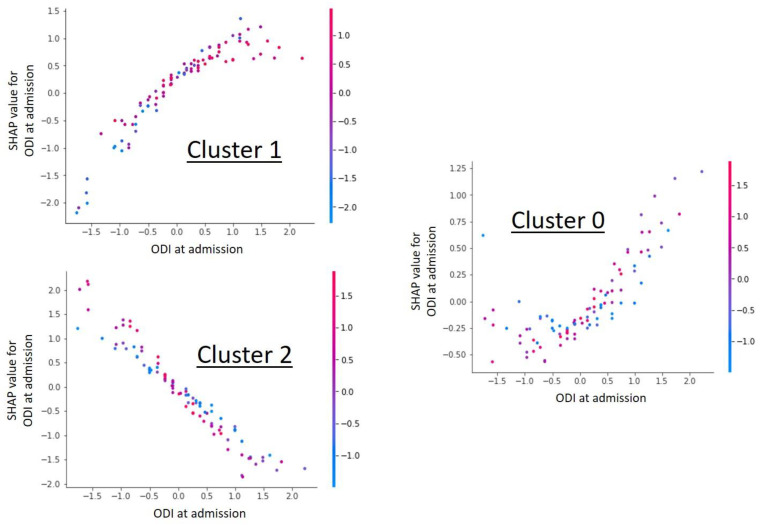
Figure 2.
Shap value analysis of the parameter “ODI at admission” for each individual cluster. The graphs show a dependency scatter plot depicting the effect of the specific feature (ODI at admission) on the entire data set for a given cluster group. It can be clearly seen that the ODI value has cluster-specific different correlations and thus a high influence on cluster formation is likely.

