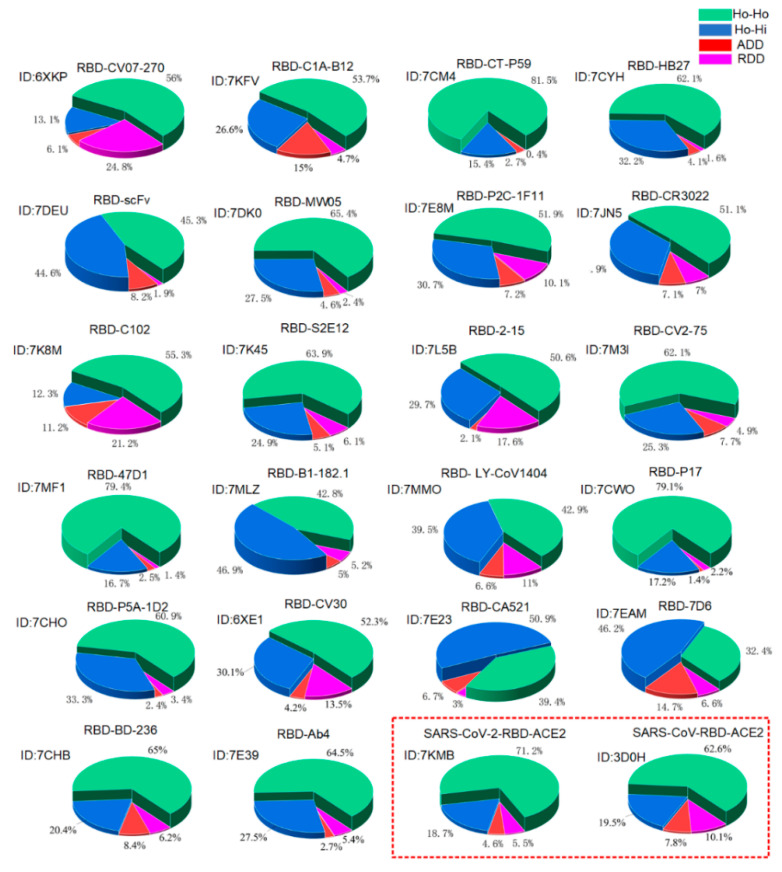
Figure 4.
The calculated proportions of SHo-Ho, SHo-Hi, SADD, and SRDD at the interface of RBD–antibody complexes, the RBD–ACE2 complex, and the SARS-CoV-S-RBD–ACE2 complex. The PDBIDs are added in the figure. The results of RBD–ACE2 complex, and the SARS-CoV-S-RBD–ACE2 complex are highlighted with a red dash line.

