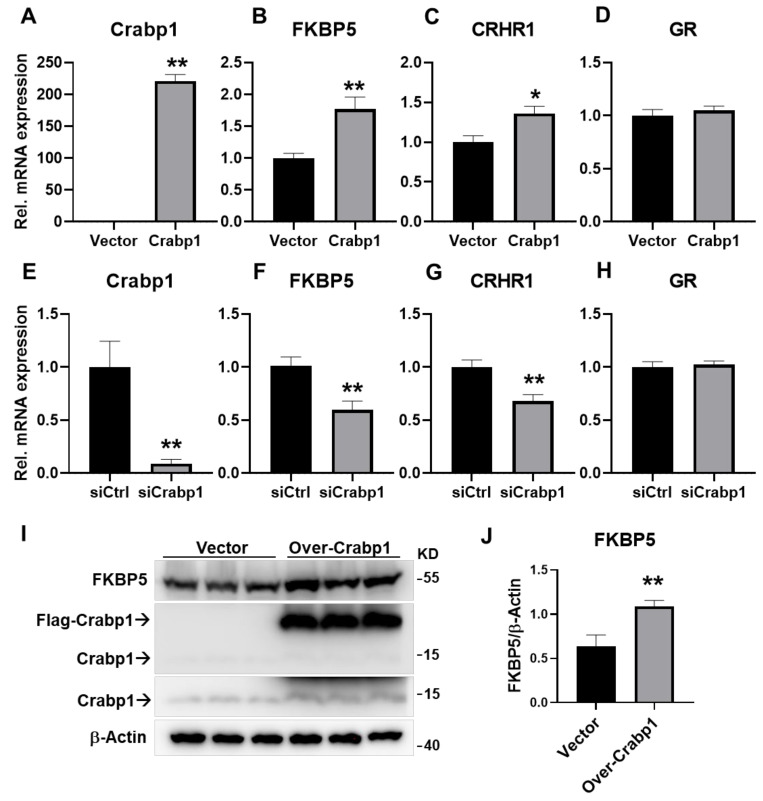
Figure 4.
Changes in mRNA levels of Crabp1, FKBP5, CRHR1, and GR and FKBP5 protein levels in AtT20 cells with elevated (over-expression) or lowered (silencing) Crabp1 levels. (A–D) mRNA levels of key genes in Crabp1-elevated AtT20 cell (n = 6/groups). (E–H) mRNA levels of key genes in Crabp1-lowered AtT20 cell (n = 6/groups). (I,J) Changes in FKBP5 protein levels upon Crabp1-expression. Labels are indicated as “Vector” = Empty vector control; “Over-Crabp1” = Crabp1 overexpression; “# Crabp1” = endogenous Crabp1 imaged with a short (top) or long exposure time (bottom). β-actin was used as a loading control. Results are presented as means ± SEM, * p ≤ 0.05, ** p ≤ 0.01, compared with the Ctrl group.

