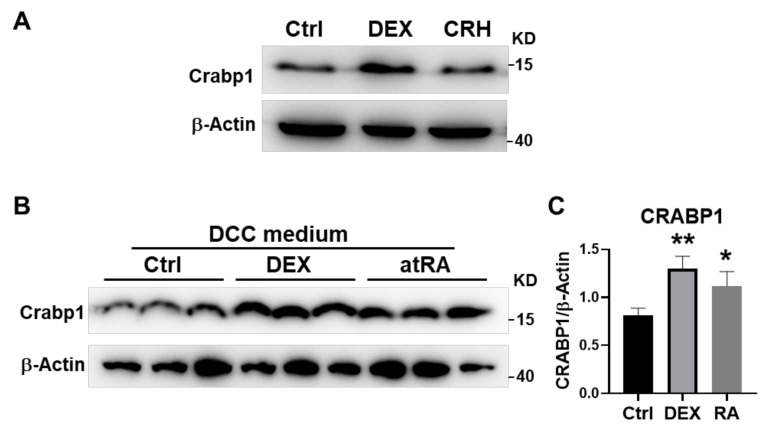
Figure 5.
Crabp1 protein levels in AtT20 cells. (A) Crabp1 level in AtT20 cells after 24 h DEX or CRH treatment. (B) Crabp1 level in AtT20 cells grown in DCC FBS-supplemented medium after 24 h. RA or DEX treatment. Western blot quantification shown in (C). β-actin was used as a loading control. Results are presented as means ± SEM, * p ≤ 0.05, ** p ≤ 0.01, compared with the Ctrl group.

