Figure 5.
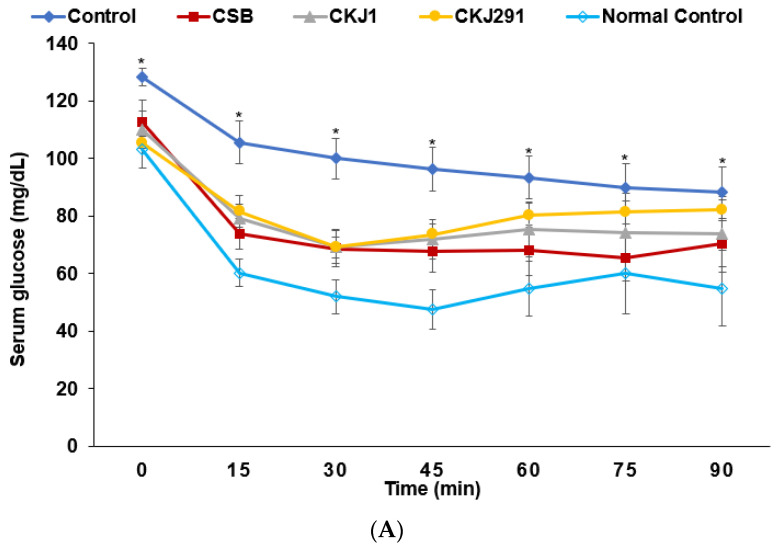
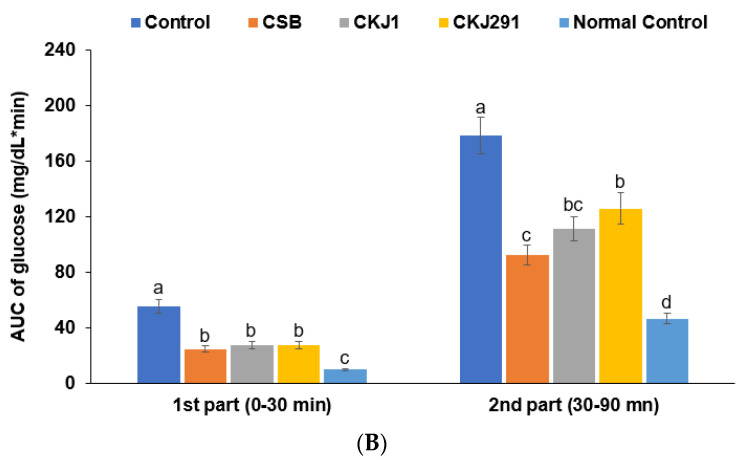
Intraperitoneal insulin tolerance test (IPITT). The gerbils underwent an IPITT with 1 IU insulin/kg body weight after 6 h food deprivation on the following day of OGTT. The changes of serum glucose levels during 90 min (A) and AUC of serum glucose in the first part (0–30 min) and the second part (30–90 min) during the IPITT (B). * Significantly different among the groups at p < 0.05. Bars and dots represent means ± SD (n = 10). a,b,c,d Means on the bars with different letters were significantly different by Tukey’s test at p < 0.05.


