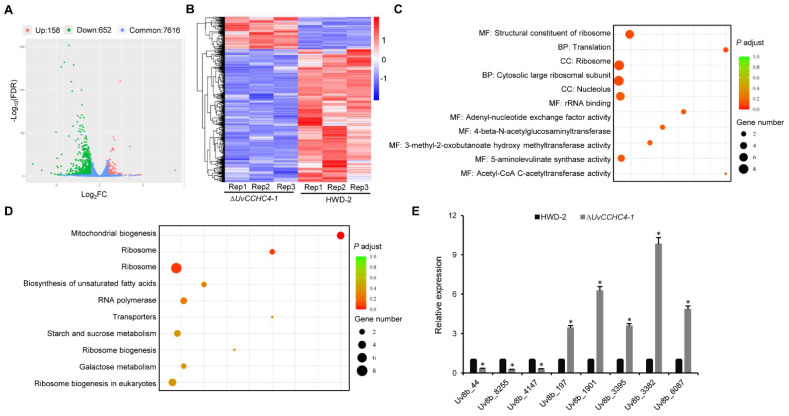
Figure 8.
Transcriptomic analysis to identify DEGs in ∆UvCCHC4-1 vs. HWD-2. (A) Volcano plot of DEGs in ∆UvCCHC4-1 vs. HWD-2. (B) Heatmap of FRKM-normalized transcript levels of the 810 DEGs in each pair-wise comparison. (C) GO enrichment analysis of the DEGs. MF: Molecular function; BP: Biological process; CC: Cellular component. (D) KEGG enrichment analysis of the DEGs. (E) RT-qPCR to validate the DEGs. The relative transcript abundance of each gene from ΔUvCCHC4-1 was normalized by comparison with the gene from HWD-2 (relative transcript level = 1). The asterisks represent significant differences between ΔUvCCHC4-1 and HWD-2 at p = 0.05.

