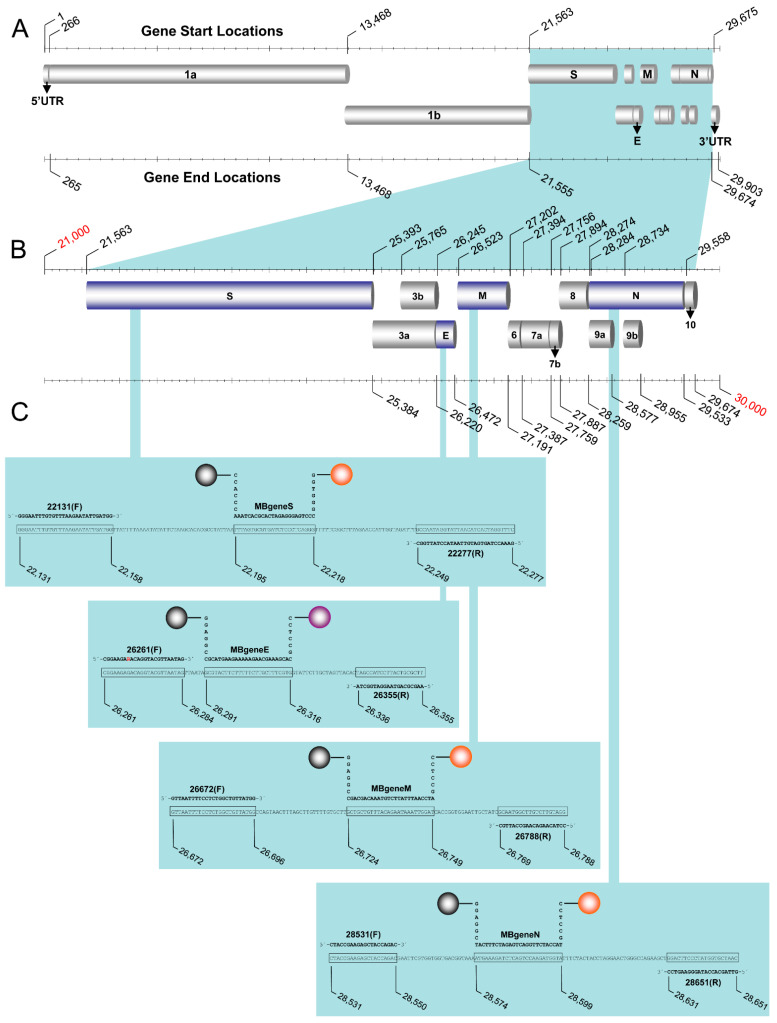
Figure 1.
Assay design. Graphic illustration of the genome of SARS-related coronavirus 2 (SARS-CoV-2). (A) The genes of the structural proteins targeted in the assay are indicated in the highlighted area. (B) The start and end locations of these genes as well as the open reading frames are demonstrated by the nucleotide positions in the magnified area [31]. (C) The target genes are further magnified to show the amplicons of each of the four genes (S, E, M, and N) integrated in the assay. The sequences of the primers and molecular beacons are shown in bold, and the target sequences of amplicons are shown in boxes. Numbers that represent the probe, forward, and reverse primers based on the SARS-CoV-2 reference genome (GenBank: MN908947.3) denote the nucleotide positions of the start and end of the target amplicons. The gray spheres (left side of each beacon) indicate the quencher N-[4-(4-dimethylamino)phenylazo]benzoic acid (DABCYL) at the 3′ end of the molecular beacon, while the orange spheres (right side of each beacon) indicate the fluorophore N-HEX-6-aminohexanol (HEX) for the S, N, and M beacons at the 5′ end. The purple sphere indicates the fluorophore N-TET-6-aminohexanol (TET) for the E gene.

