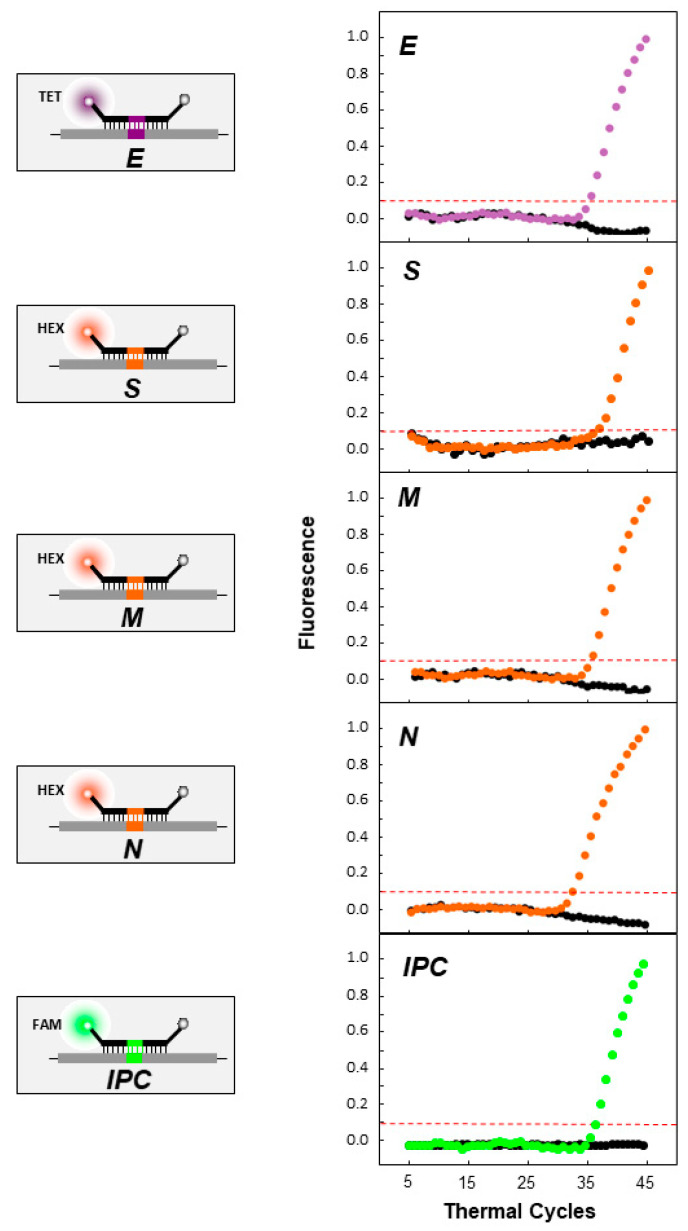
Figure 4.
Uniplex real-time RT-PCR of SARS-CoV-2 genes (S, E, M, and N genes) and the artificial IPC. On the left side of the figure, a representation of the quencher and fluorophores carried by each molecular beacon is shown. The gray spheres indicate the quencher DABCYL at the 3′ end of the molecular beacon, while the orange spheres indicate the fluorophore HEX for the S, N, and M beacons at the 5′ end. The purple sphere indicates the fluorophore TET for the E gene. The green sphere indicates the fluorophore 6-carboxy fluorescein (6-FAM) for the IPC. On the right side of each molecular beacon schematic, the fluorescence signal graph is shown for the molecular beacons and their respective targets. The negative control is indicated with black dots. The y-axis represents fluorescence, while the x-axis represents the thermal cycles. The intermittent red line represents the threshold cycle.

