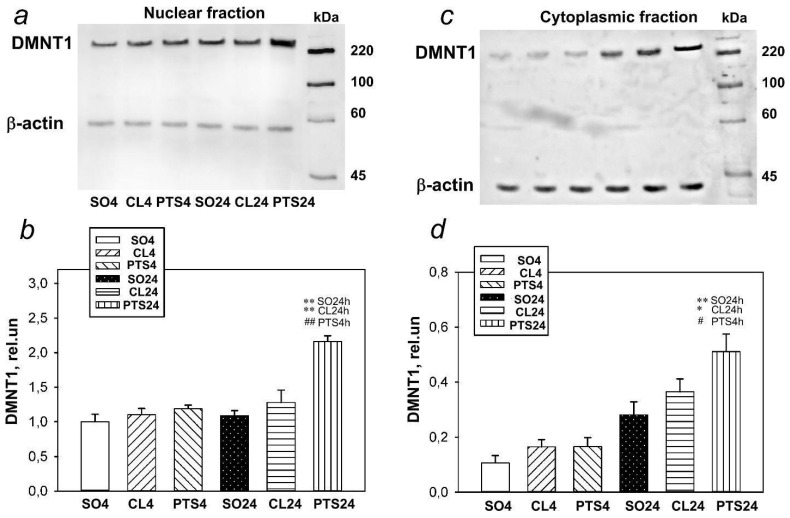
Figure 1.
The expression of DNMT1in nuclear (a,b) and cytoplasmic (c,d) fractions of penumbra tissue at 4 or 24 h after photothrombotic stroke (PTS) in the rat cerebral cortex. The significant differences * p < 0.05 and ** p < 0.01 compared to sham-operated animals (SO) or contralateral cerebral cortex of the same animals (CL4 and CL24), # p < 0.05 and ## p < 0.01 compared to the PTS4 are shown. One-way ANOVA. M ± SEM. n = 7. Rel.un—the ratio of the optical density of the strip of the protein studied to the optical density of the strip of the protein load marker (actin).

