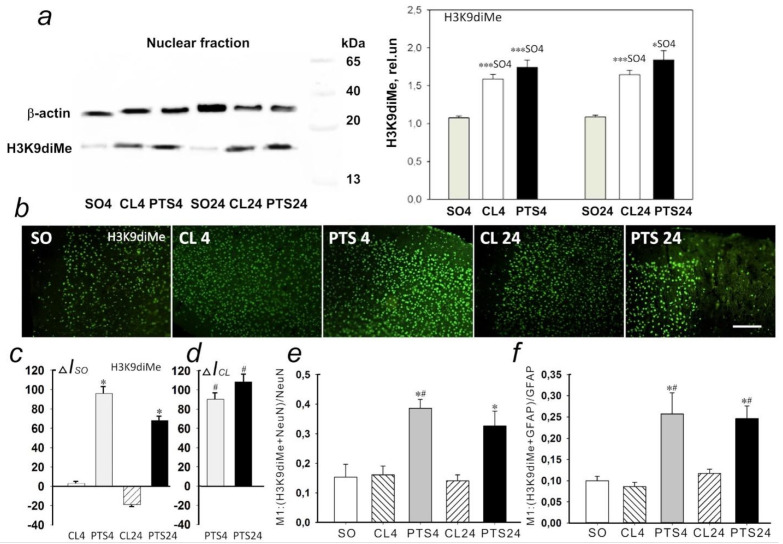
Figure 10.
Expression of lysine 9 dimethylated histone H3 (H3K9diMe) in the penumbra and control samples of the cerebral cortex of sham-operated rats (SO) or the cerebral cortex in the contralateral hemisphere of the same animal (CL4 and CL24) at 4 and 24 h after photothrombotic stroke in the right hemisphere of the rat brain (PTS4 and PTS24). (a) Western blotting of H3K9diMe in the nuclear fraction of rat brain tissue. One Way ANOVA; M ± SEM, N = 8, * p < 0.05; *** p < 0.001 relative to sham-operated animals. (b) Immunofluorescence of H3K9diMe-positive cells in the cerebral cortex of sham-operated rats (SO), in the unirradiated contralateral cortex (CL4 and CL24) and in the penumbra at 4 and 24 h after photothrombotic stroke (PTS4 and PTS24). Scale section: 150 microns. (c) Percentage changes in the fluorescence intensity of H3K9diMe-positive cells in the penumbra and contralateral cortex at 4 or 24 h after PTS relative to that in sham-operated animals (ΔIso). (d) Percentage changes in the fluorescence intensity of H3K9diMe-positive cells in the penumbra at 4 or 24 h after PTS in the rat cerebral cortex relative to the contralateral cortex (ΔICL). ANOVA, n = 8, * p < 0.05 relative to sham-operated animals, # p < 0.05 relative to the contralateral hemisphere. (e,f) Average values of the M1 colocalization coefficient reflecting the proportion of pixels with a red signal (cellular marker, NeuN (e) or GFAP (f)) containing the green signal (H3K4me) in relation to the common signal from the red channel. M ± SEM, ANOVA, n = 8; * p < 0.05 relative to sham-operated animals; # p < 0.05, relative to the contralateral hemisphere. Rel.un—the ratio of the optical density of the strip of the protein studied to the optical density of the strip of the protein load marker (actin).

