Figure 11.
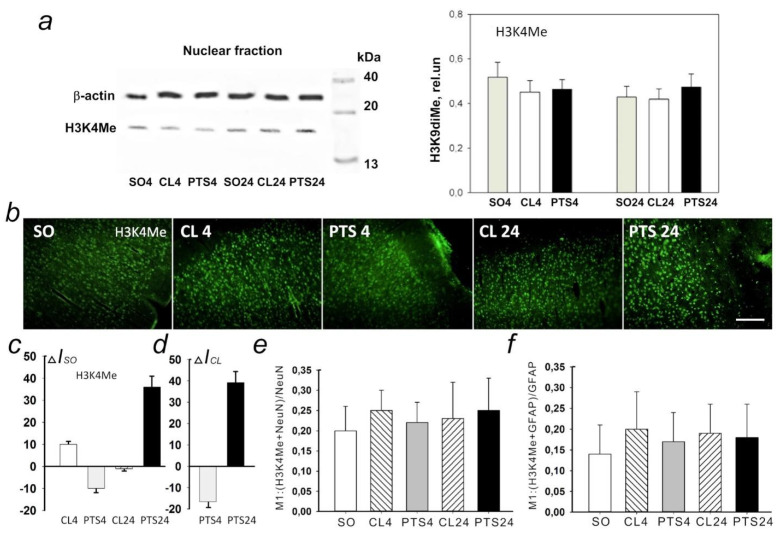
Expression of histone H3 monomethylated for lysine 4 (H3K4Me) in the penumbra and control samples of the cerebral cortex of sham-operated rats (SO) or cerebral cortex in the contralateral hemisphere of the same animal (CL4 and CL24) 4 and 24 h after photothrombotic stroke in the right hemisphere of the rat brain (PTS4 and PTS24). (a) Western blotting of H3K4Me in the nuclear fraction of rat brain tissue. One Way ANOVA; M ± SEM, n = 8. (b) Immunofluorescence of H3K4Me-positive cells in the cerebral cortex of SO rats, in the unirradiated contralateral cortex (CL4 and CL24) and in the penumbra at PTS4 and PTS24. Scale section: 150 microns. (c) Percentage changes in the fluorescence intensity of H3K4me-positive cells in the penumbra and contralateral cortex at PTS4 and PTS24 relative to that in SO animals (ΔIso). (d) Percentage changes in the fluorescence intensity of H3K4Me-positive cells in the penumbra at PTS4 and PTS24 in the rat cerebral cortex relative to the contralateral cortex (ΔICL). One Way ANOVA, n = 8. (e,f) Average values of the M1 colocalization coefficient reflecting the proportion of pixels with a red signal (cellular marker, NeuN (e) or GFAP (f)), containing a green signal (H3K4Me), in relation to the common signal from the red channel. M ± SEM, ANOVA, n = 8; Rel.un—the ratio of the optical density of the strip of the protein studied to the optical density of the strip of the protein load marker (actin).

