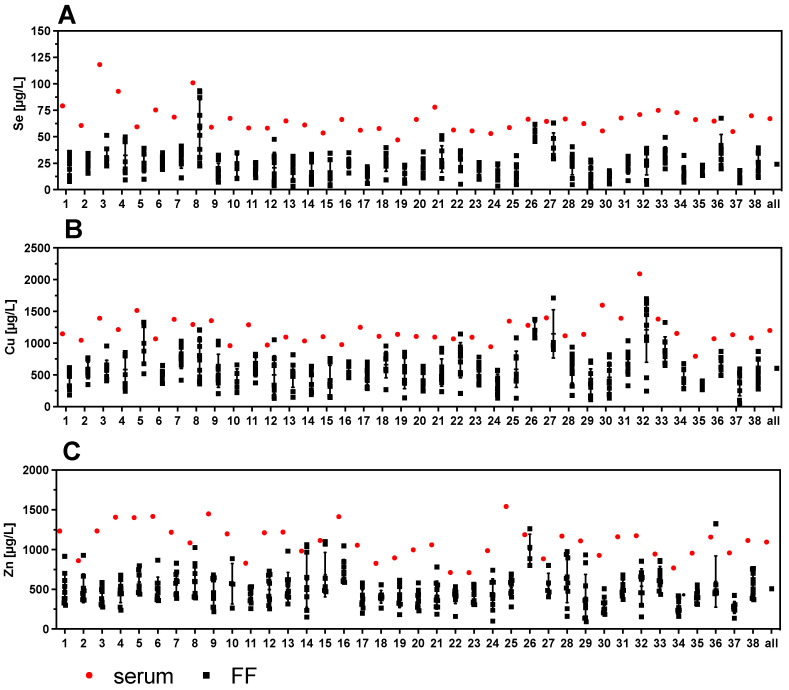
Figure 4.
Comparison of TE concentrations in serum and corresponding follicular fluids (FF). Trace element concentrations of one serum sample with up to 10 corresponding FF were compared per patient. The results indicate a wide variation in TE concentrations in the different FF with regards to (A) Se, (B) Cu, and (C) Zn. Samples 20–37 correspond to women with PCOS.

