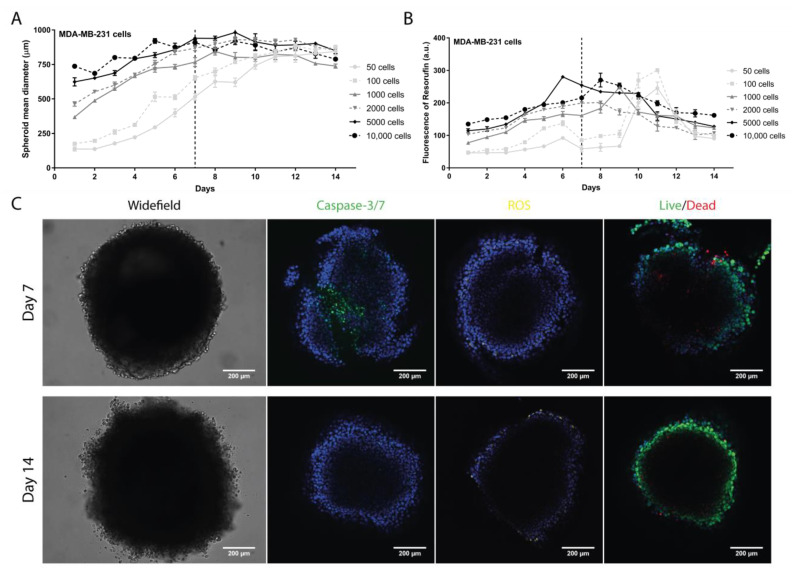
Figure 1.
Evaluation of the MDA-MB-231 spheroid formation. (A) Spheroid diameter (µm) daily monitoring over 14 days measured with a widefield fluorescence microscope. (B) Spheroid cell metabolic activity daily evaluation over 14 days by measuring the fluorescence emission of resorufin with a microplate reader. (C) Representative images of parameters evaluated on days 7 and 14 at 2000 cells/well with a confocal point-scanning Zeiss LSM 880 microscope. In the apoptosis determination, apoptotic cells are marked in green; in the oxidative stress measurement, reactive oxygen species (ROS) are marked in yellow; and in the cell viability/mortality evaluation, intact cells (live) are marked in green and permeabilized cells (dead) in red. In all experiments, cell nucleus is marked in blue. Scale bar = 200 µm. Graphs represent at least three biological repeats.

