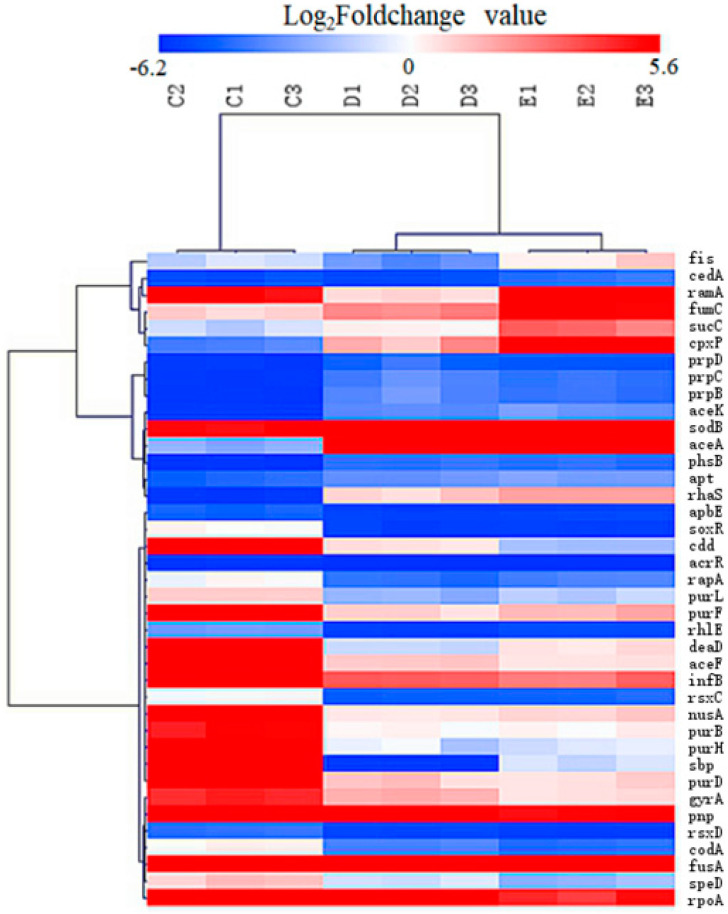
Figure 5.
Heatmap of the candidate key genes involved in the sub-MIC induced ENR resistance in S. Enteritidis. “C1, C2, C3”, “D1, D2, D3”, “E1, E2, E3” represent triplicate of mutants 32M (1/2M), 16M (1/32M) and 8M (1/128M); “red colour” represents gene up-regulation, “blue colour” represents gene down-regulation, and the shade of the color indicates the degree of gene expression.

