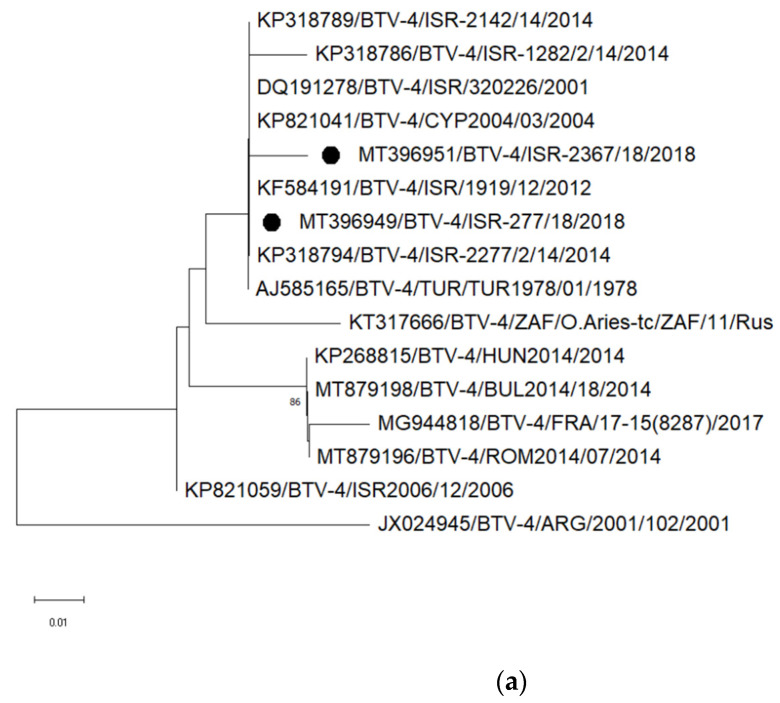
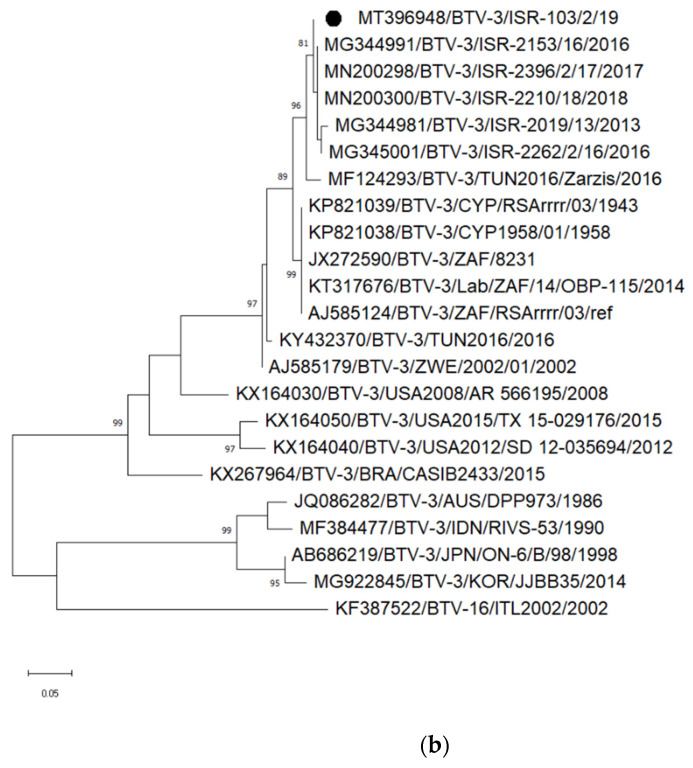
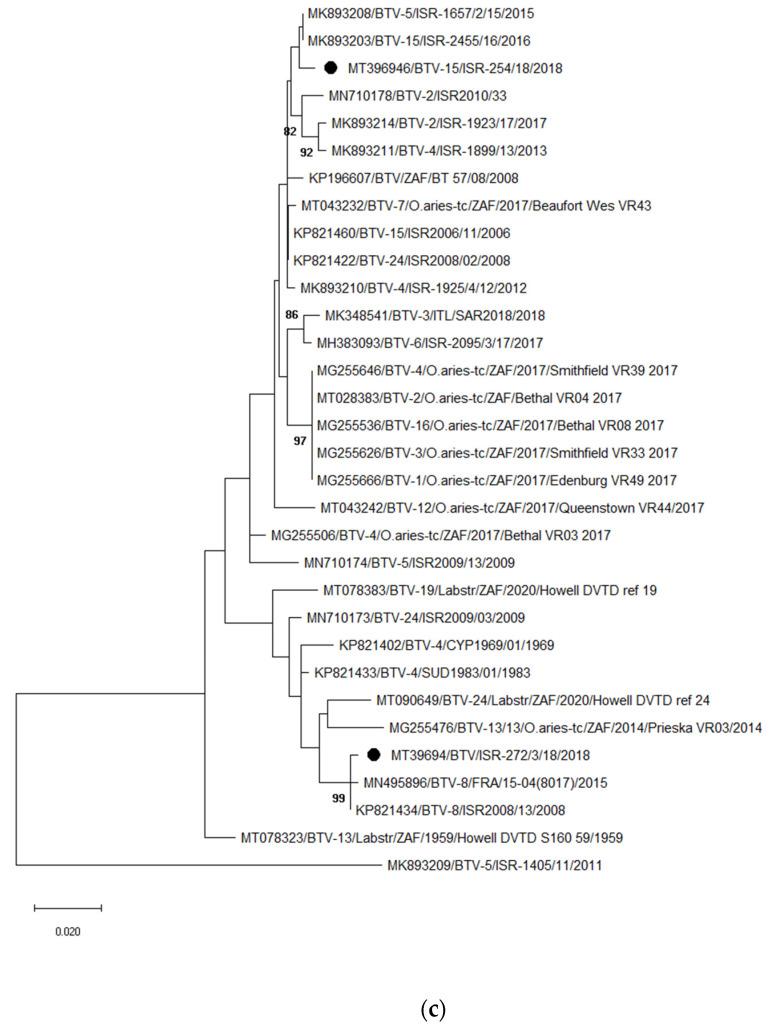
Figure 2.
Phylogenetic analyses based on partial sequences of bluetongue viruses. (a) BTV-4, segment 2 (Seg-2); (b) BTV-3, Seg-2; (c) previous local (Israeli) strains and newly sequenced strains, Seg-5. The sequences obtained from NCBI GenBank are labelled by accession number/serotype/location/isolate/year (when all data is available in GenBank or the corresponding publications) and sequences generated in the present study are marked by black dots. Nucleotide sequences were analyzed using the Maximum Likelihood method and Tamura-Nei model. Statistical support for nodes was obtained by bootstrapping (1000 replicates); only values ≥ 70 % are shown. Scale bars indicate nucleotide substitutions per site.


