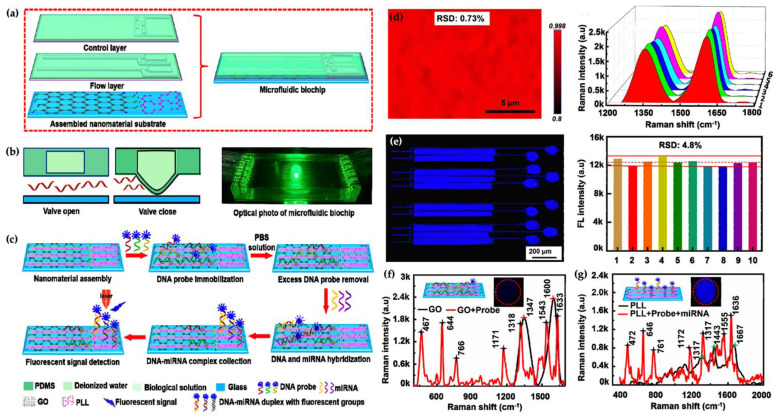
Figure 3.
İllustration of the microfluidic chip; and the Raman mapping and representative (a–c) was also used to indicate all areas of interest and were assembled with graphene oxide (GO). (d–g) shows the fluorescence mapping images of the detection chamber [81].

