Figure 5.
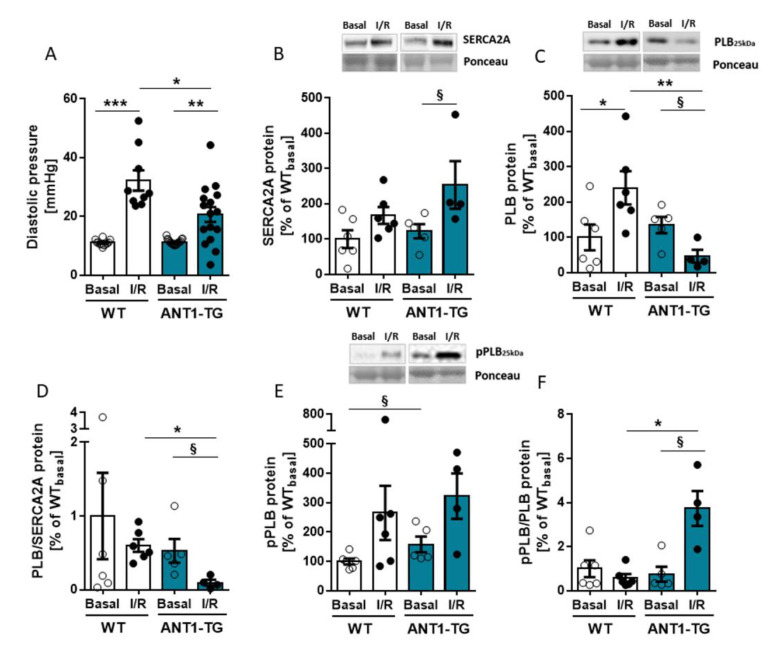
Diastolic pressure and calcium-handling proteins. (A) Diastolic pressure (Pdia) of WT and ANT1-TG hearts. Data are shown for the pre-ischemic stabilization phase (Basal) and after 120 min of reperfusion (I/R) (WT, n = 10–12; ANT1-TG, n = 16–19). WT and ANT1-TG mitochondria were isolated after 15 min of basal perfusion (Basal) or after 45 min of ischemia, followed by two hours of reperfusion (I/R), and protein extracts were prepared. Figures show the (B) SERCA2a (C), PLB, (D) the PLB/SERCA2a ratio, (E) phosphorylated PLB (pPLB), and (F) the pPLB/PLB ratio, as assessed by Western blot quantification. Upper panels of graphs (B,C,E) show representative Western blots. Data are presented as the mean ± SEM from four to six heart preparations. Asterisks indicate significant differences * p < 0.05, ** p < 0.01, *** p < 0.001 using one-way ANOVA or Kruskal–Wallis with the respective post hoc tests or § p < 0.05 calculated using the Mann–Whitney U test.

