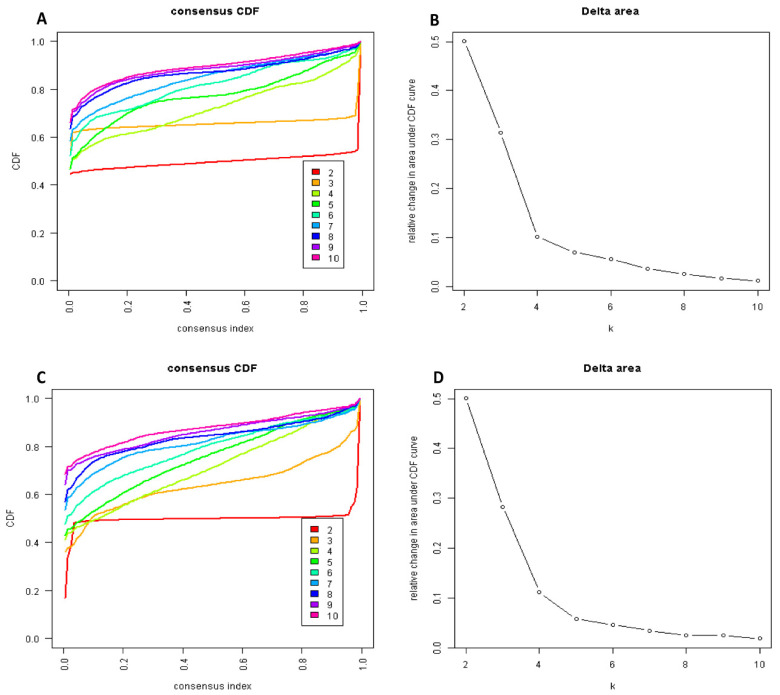
Figure 1.
(A) Cumulative distribution function (CDF) plot displaying consensus distributions for each cluster (k) for patients with hypomagnesemia; (B) Delta area plot reflecting the relative changes in the area under the CDF curve for hypomagnesemia. (C) CDF plot displaying consensus distributions for each cluster (k) for patients with hypermagnesemia; (D) Delta area plot reflecting the relative changes in the area under the CDF curve for hypermagnesemia.

