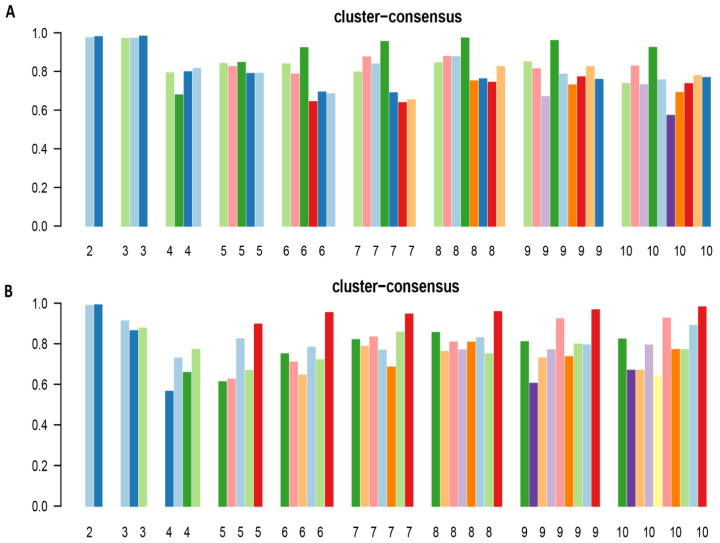
Figure 3.
(A) The bar plot represents the mean consensus score for different numbers of clusters (K ranges from two to ten) for patients with hypomagnesemia; (B) The bar plot represents the mean consensus score for different numbers of clusters (K ranges from two to ten) for patients with hypermagnesemia.

