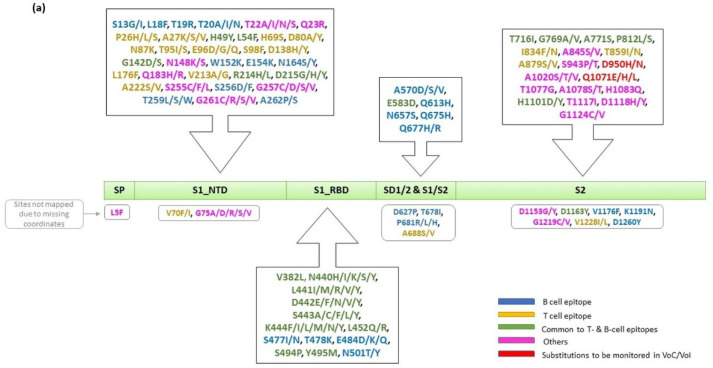
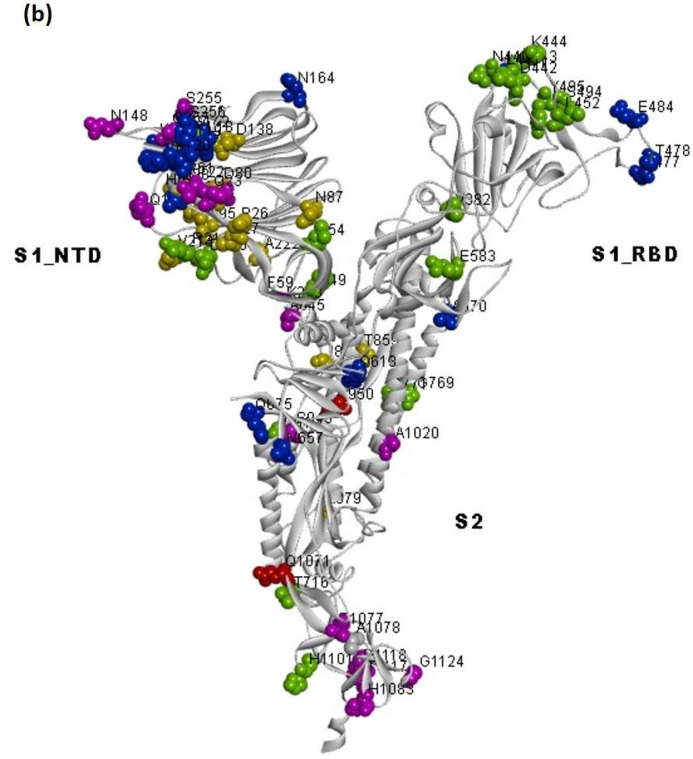
Figure 6.
Sites under positive selection mapped on domain organization of spike (a,b) 3D structure (PDB ID: 7DF3). Note: Sites are color coded as B-cell epitopes (blue), T-cell epitopes (yellow), common to T- and B-cell epitopes (green), Others (magenta), and substitutions to be monitored in VoC/VoI (red).


