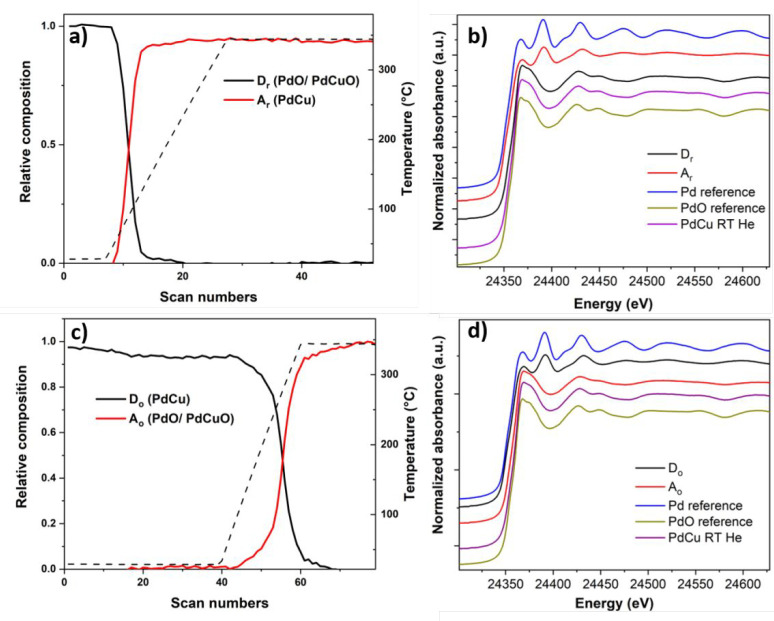
Figure 6.
Concentration profiles of principal components as a function of the temperature during reduction (a) and oxidation (c) at the Pd K-edge. XANES spectra of the species formed during reduction (b) and oxidation (d) for the supported Pd–Cu NCs along with the XANES spectra of Pd and PdO references and supported Pd–Cu NC spectrum collected at room temperature in He.

