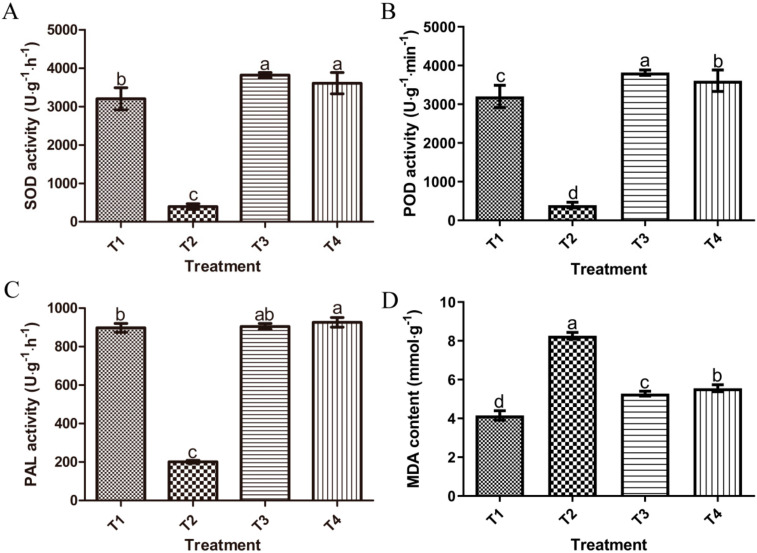
Figure 5.
Superoxide dismutase (SOD), peroxidase (POD) and phenylalanine ammonia lyase (PAL) activities and malondialdehyde (MDA) content in wheat seedlings. T1 (control, normal-grown wheat seedlings), T2 (inoculation with B. sorokiniana), T3 (carbendazim treatment after inoculation with B. sorokiniana) and T4 (XZ34-1 CF treatment after inoculation with B. sorokiniana). (A) = SOD activity, (B) = POD activity, (C) = PAL activity, (D) = MDA content. The data presented are the mean value of at least five repeats. Letters on bars indicate DMRT at p < 0.05.

