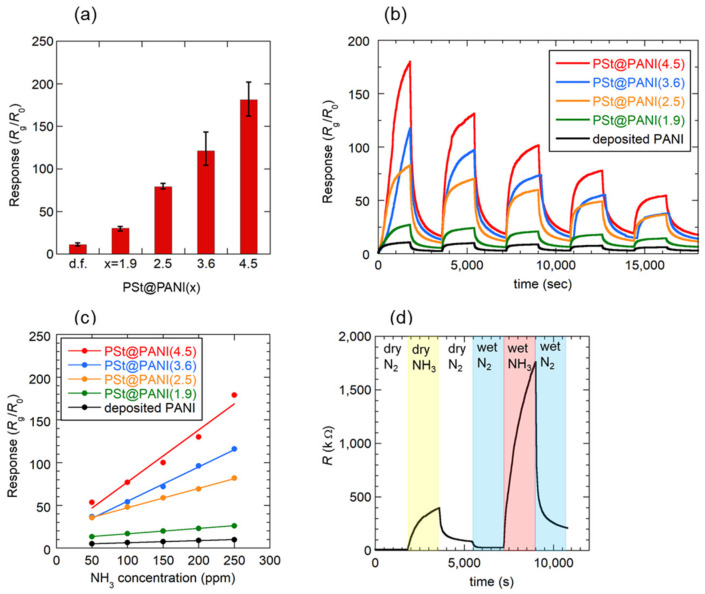
Figure 3.
NH3 gas sensing characteristics obtained for the PSt@PANI(x) sensor: (a) magnitude of the sensor response toward 250 ppm dry NH3, (b) transient response curves when the dry NH3 gas concentration is reduced by 50 ppm from 250 ppm to 50 ppm, (c) calibration curves between 50–250 ppm dry NH3 gas, and (d) effect of the humidity (50% RH) on the sensor response of the PSt@PANI(1.9) sensor. All measurements were performed at 30 °C.

